Exploratory Data Analysis of Anxiety and Predictors
This exploratory data analysis examines how a range of behavioral, physiological, and demographic predictors relate to self-reported anxiety levels (1–10). The goal is to surface patterns, distributions, and potential structural distinctions that may guide future modeling decisions.
Visualizations
Single Variable Plots
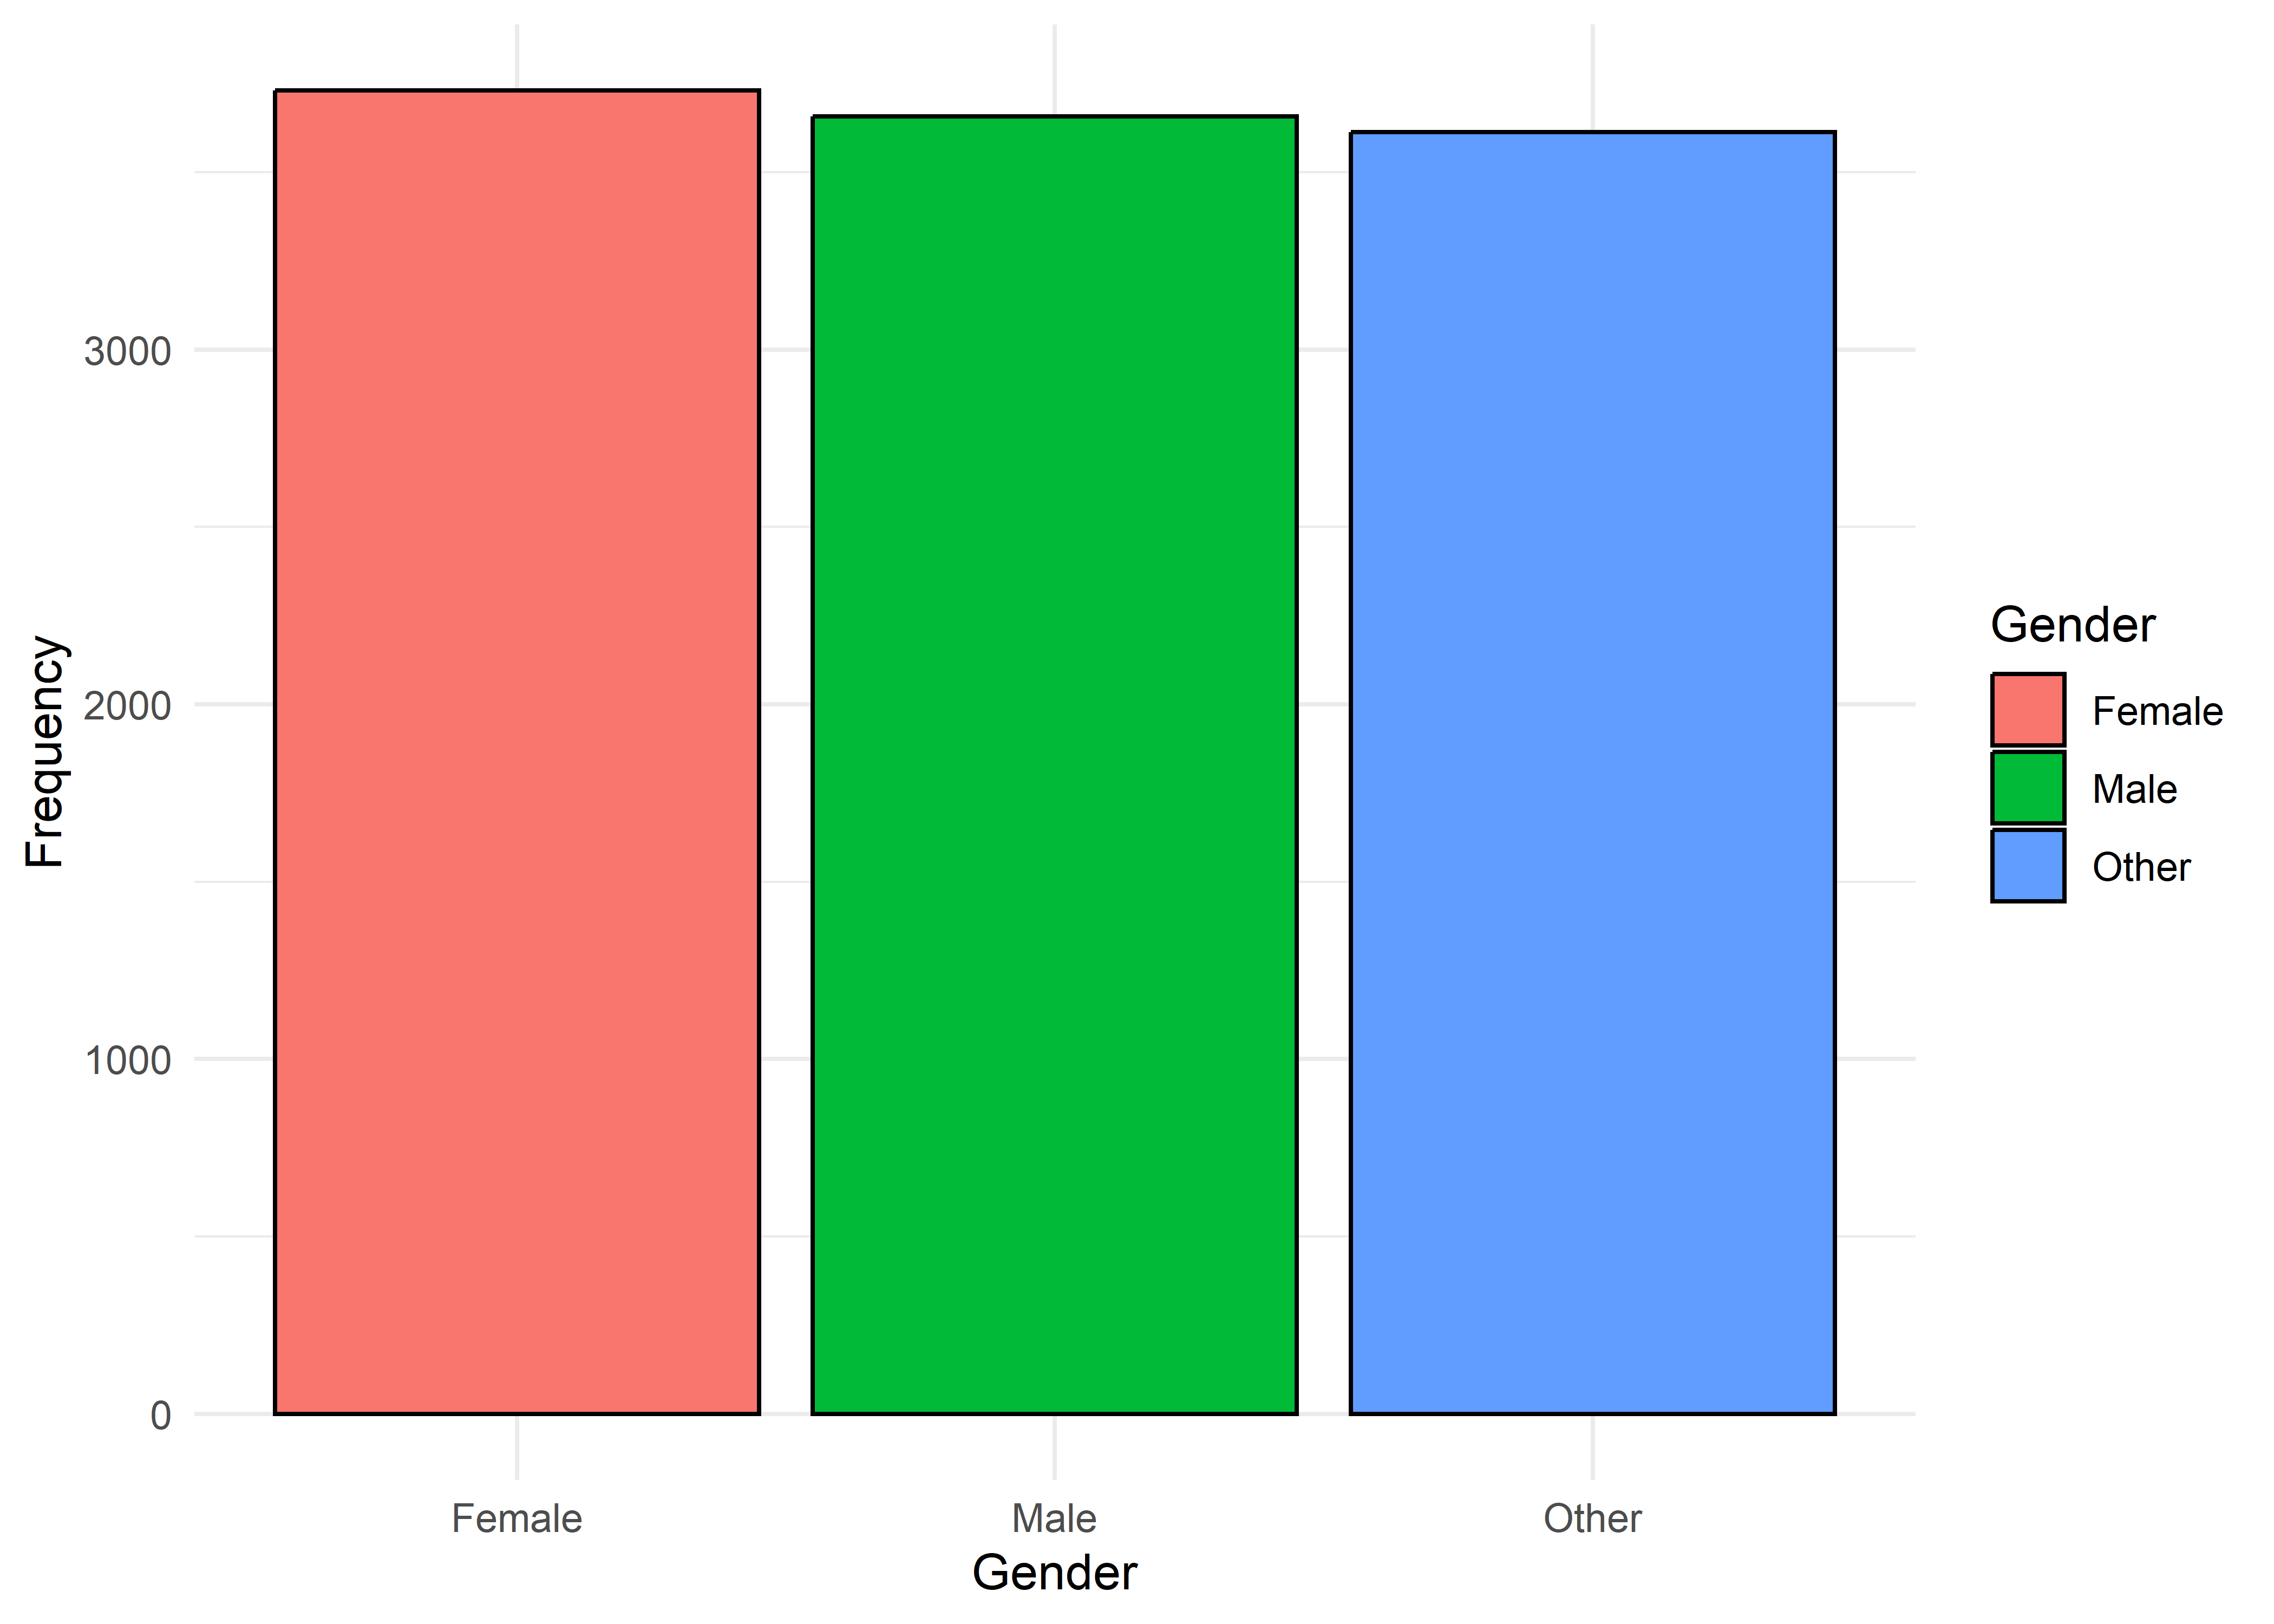
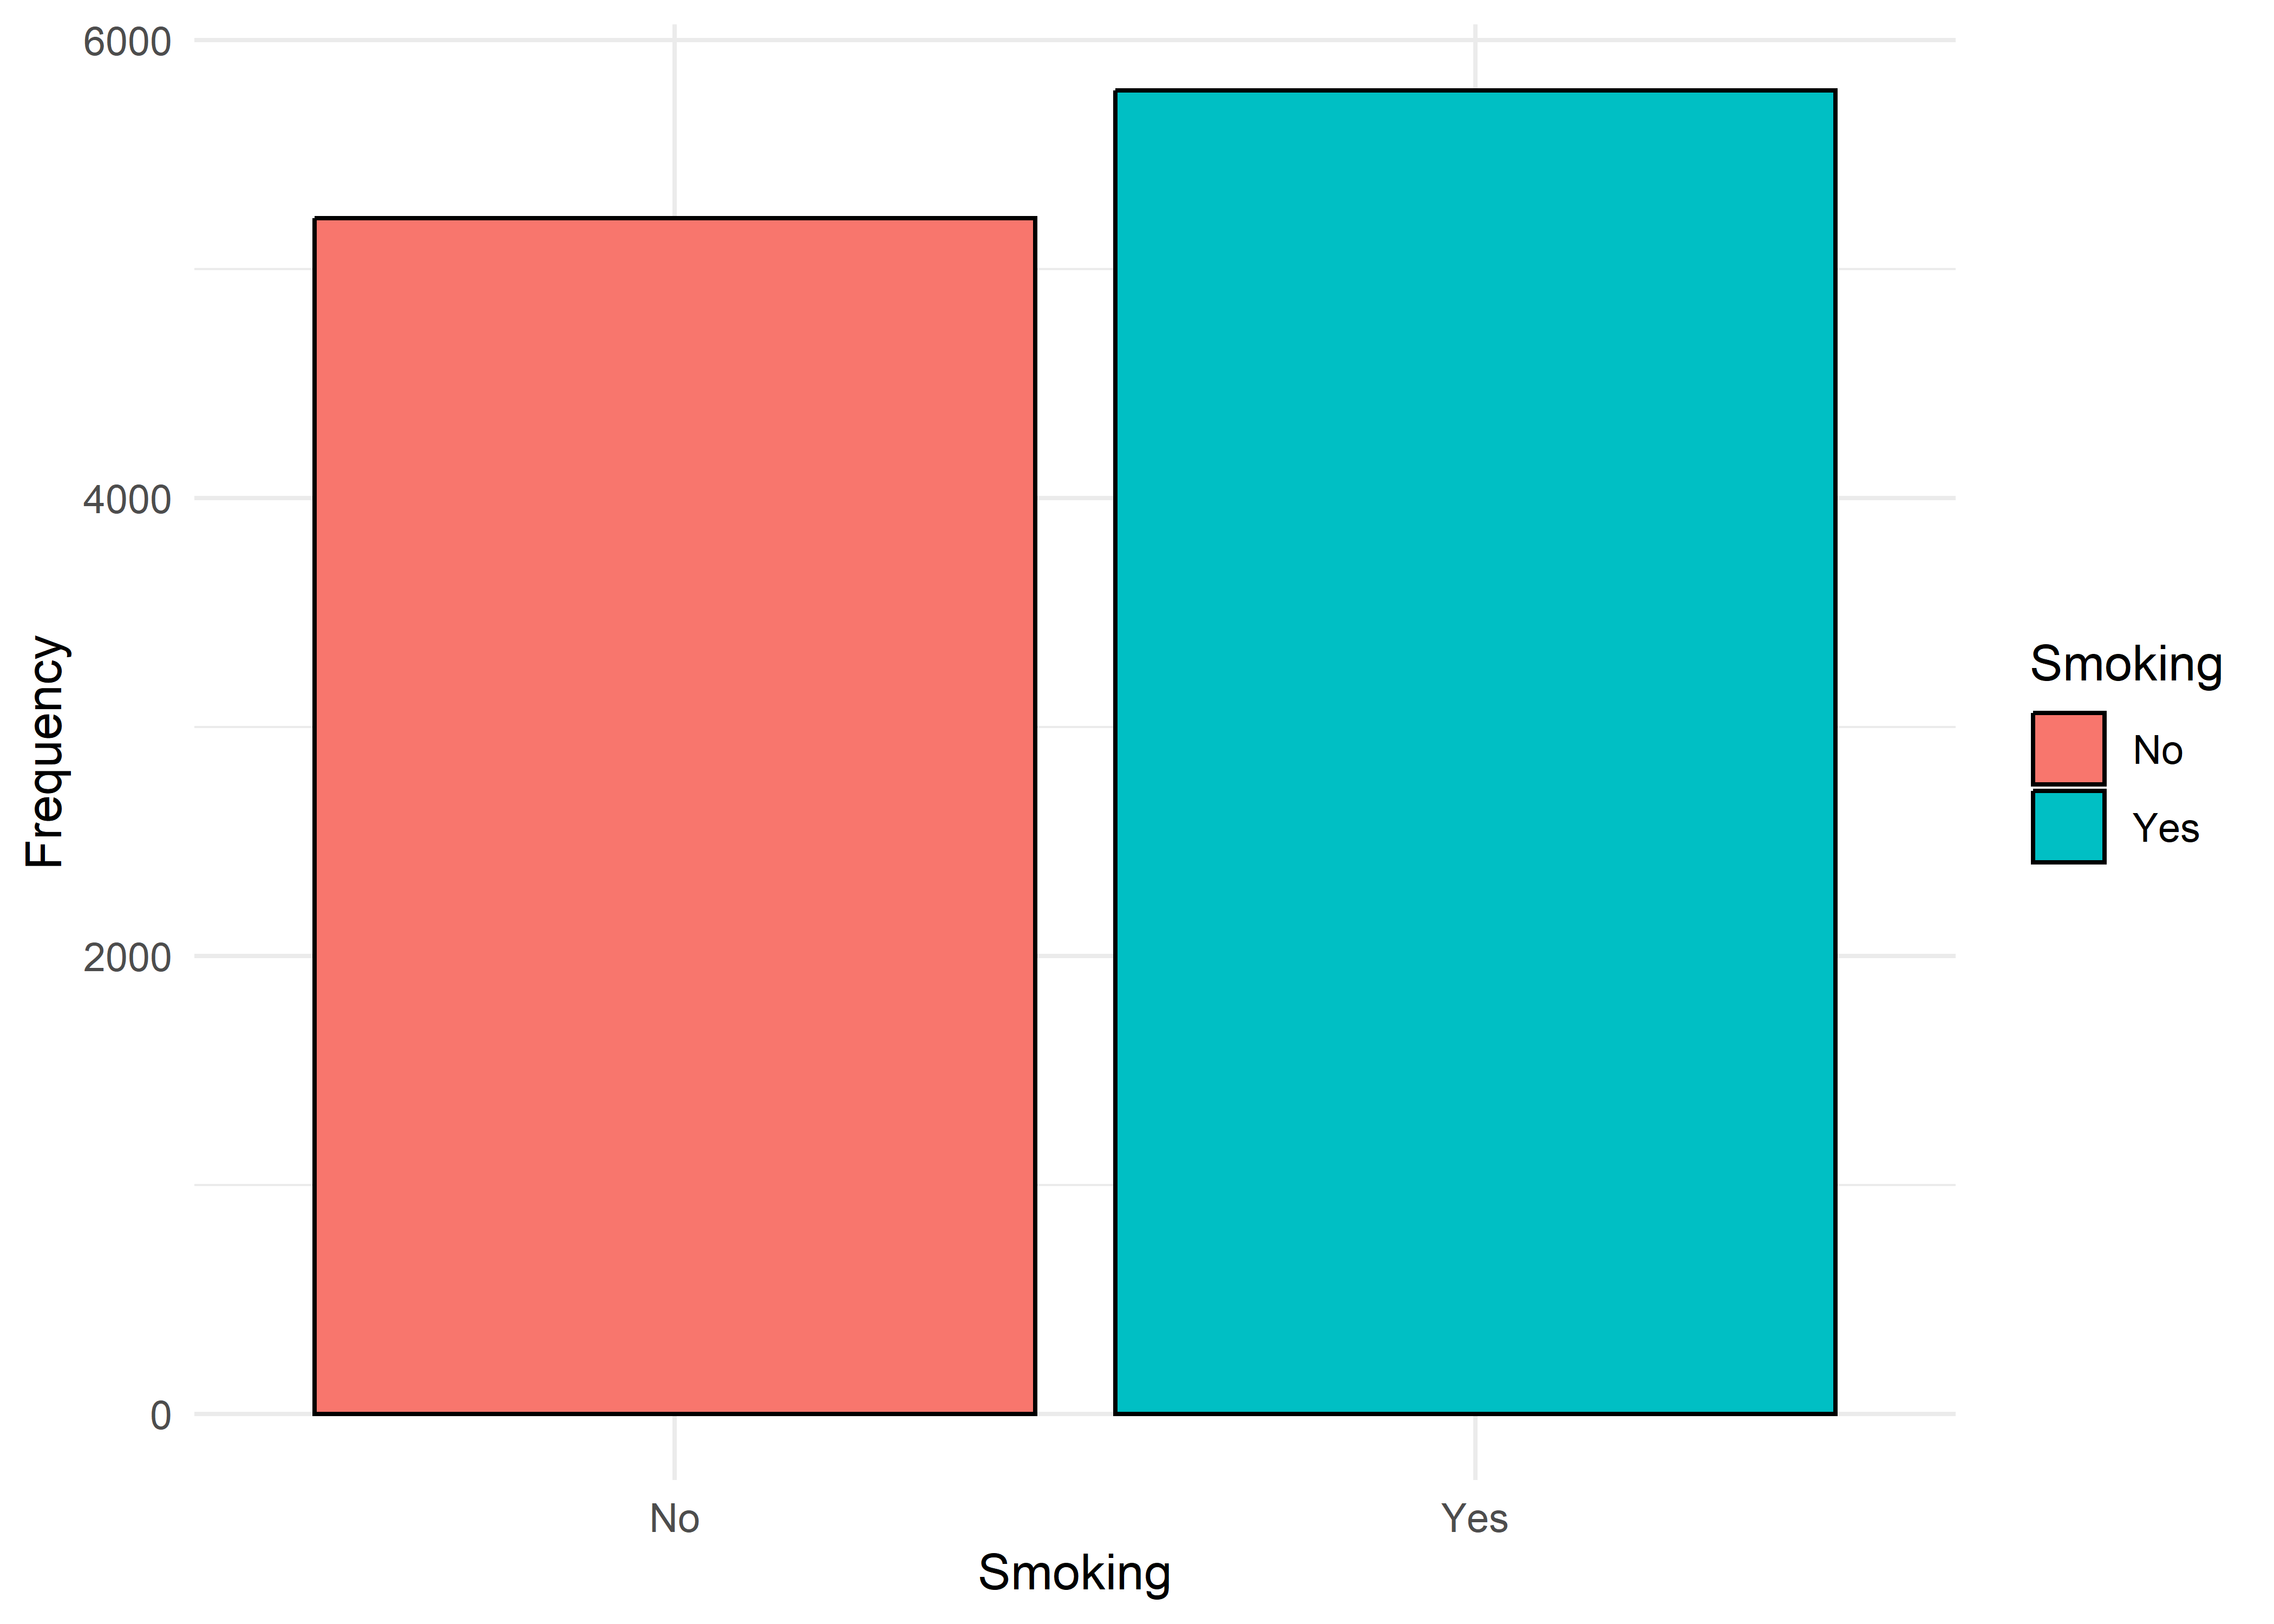
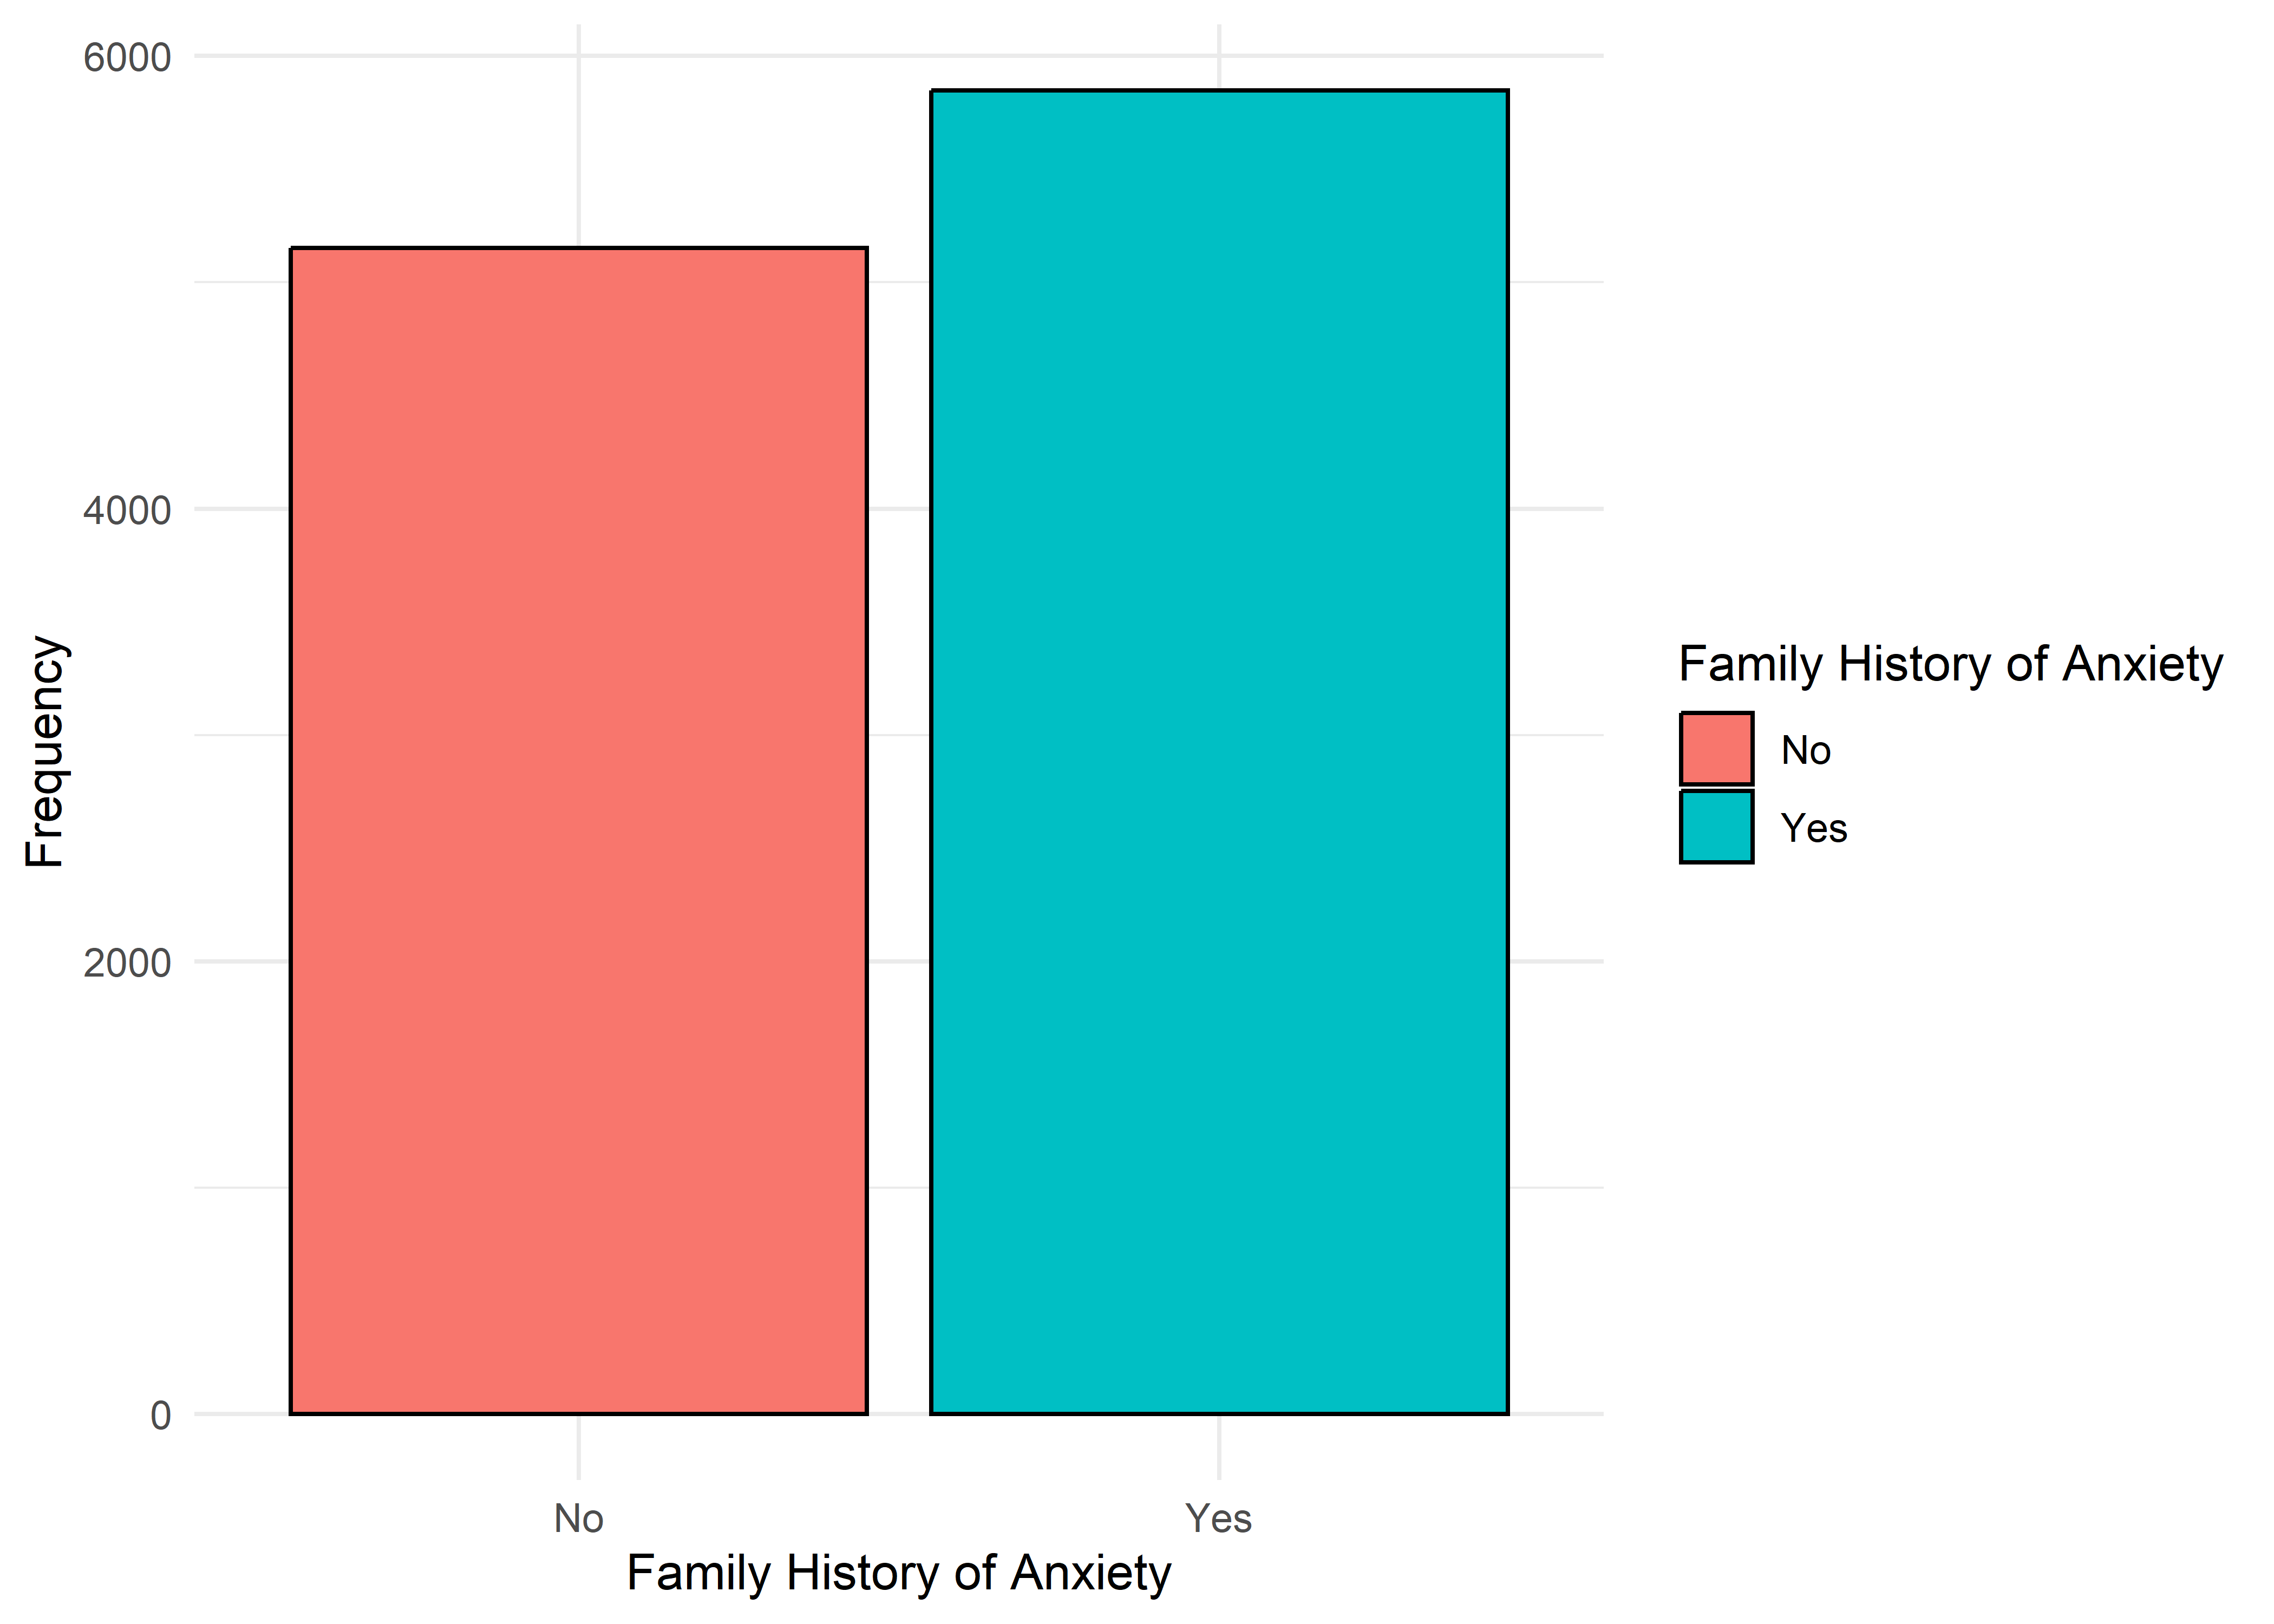
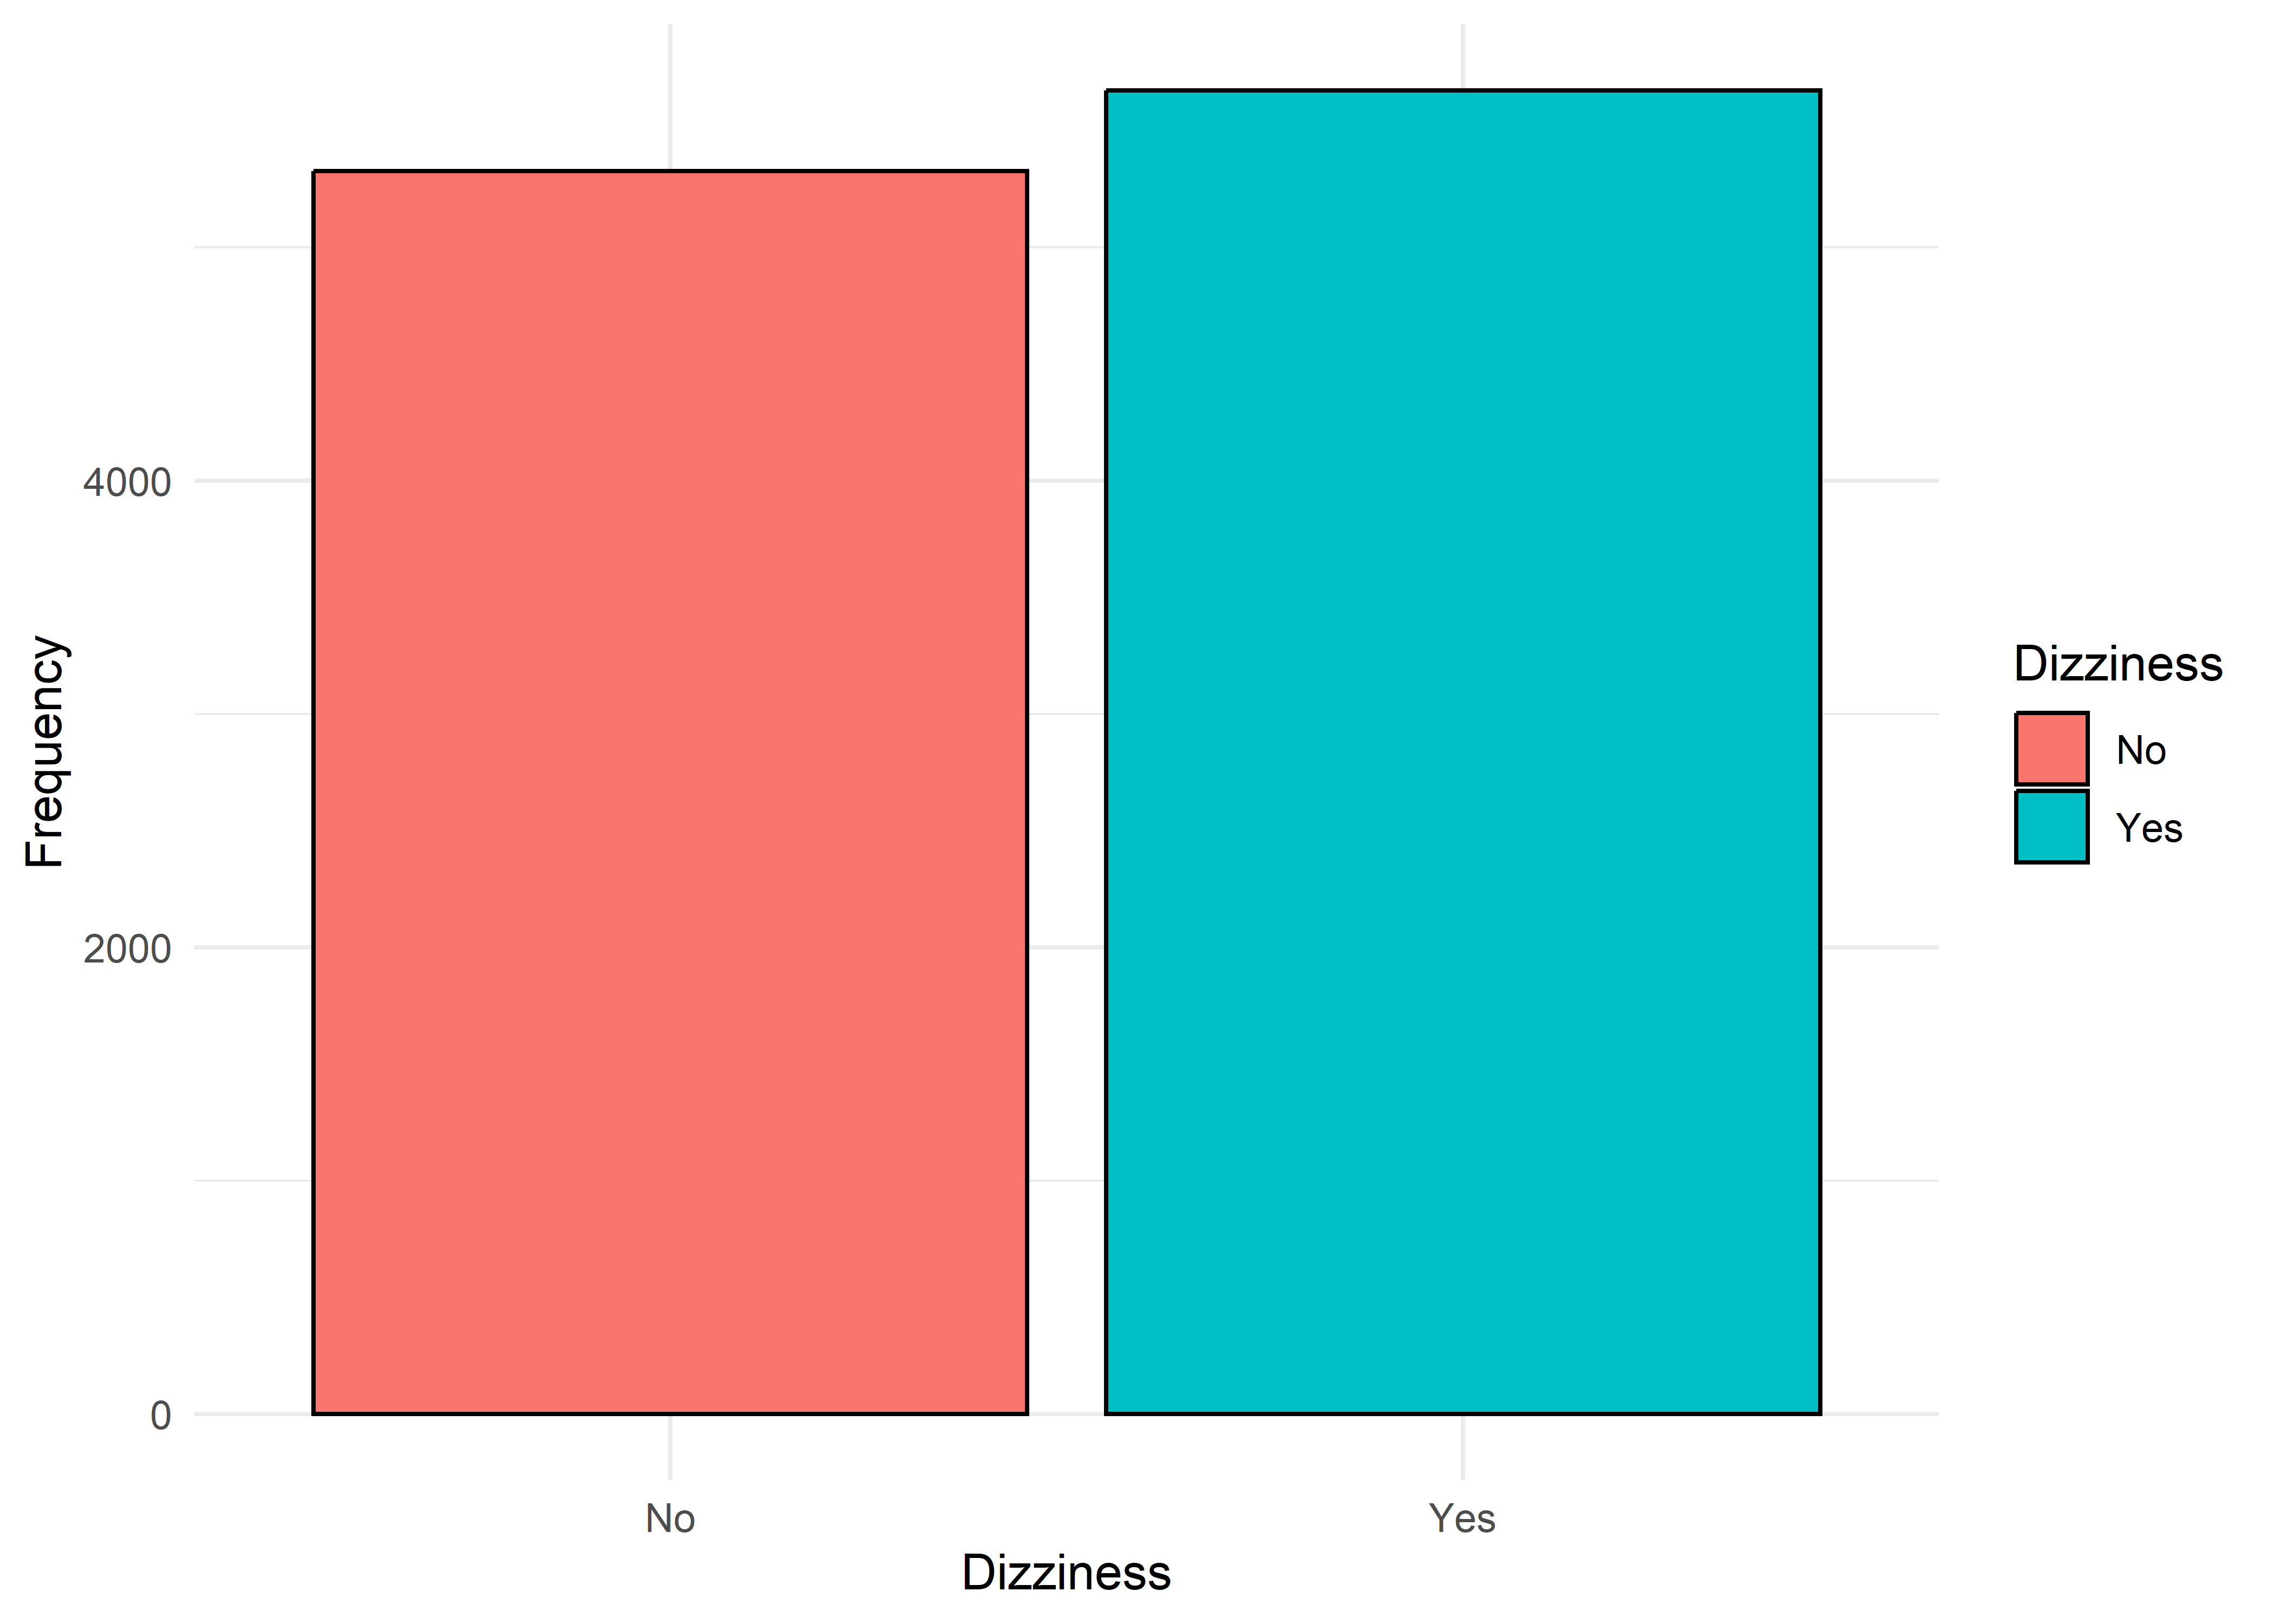
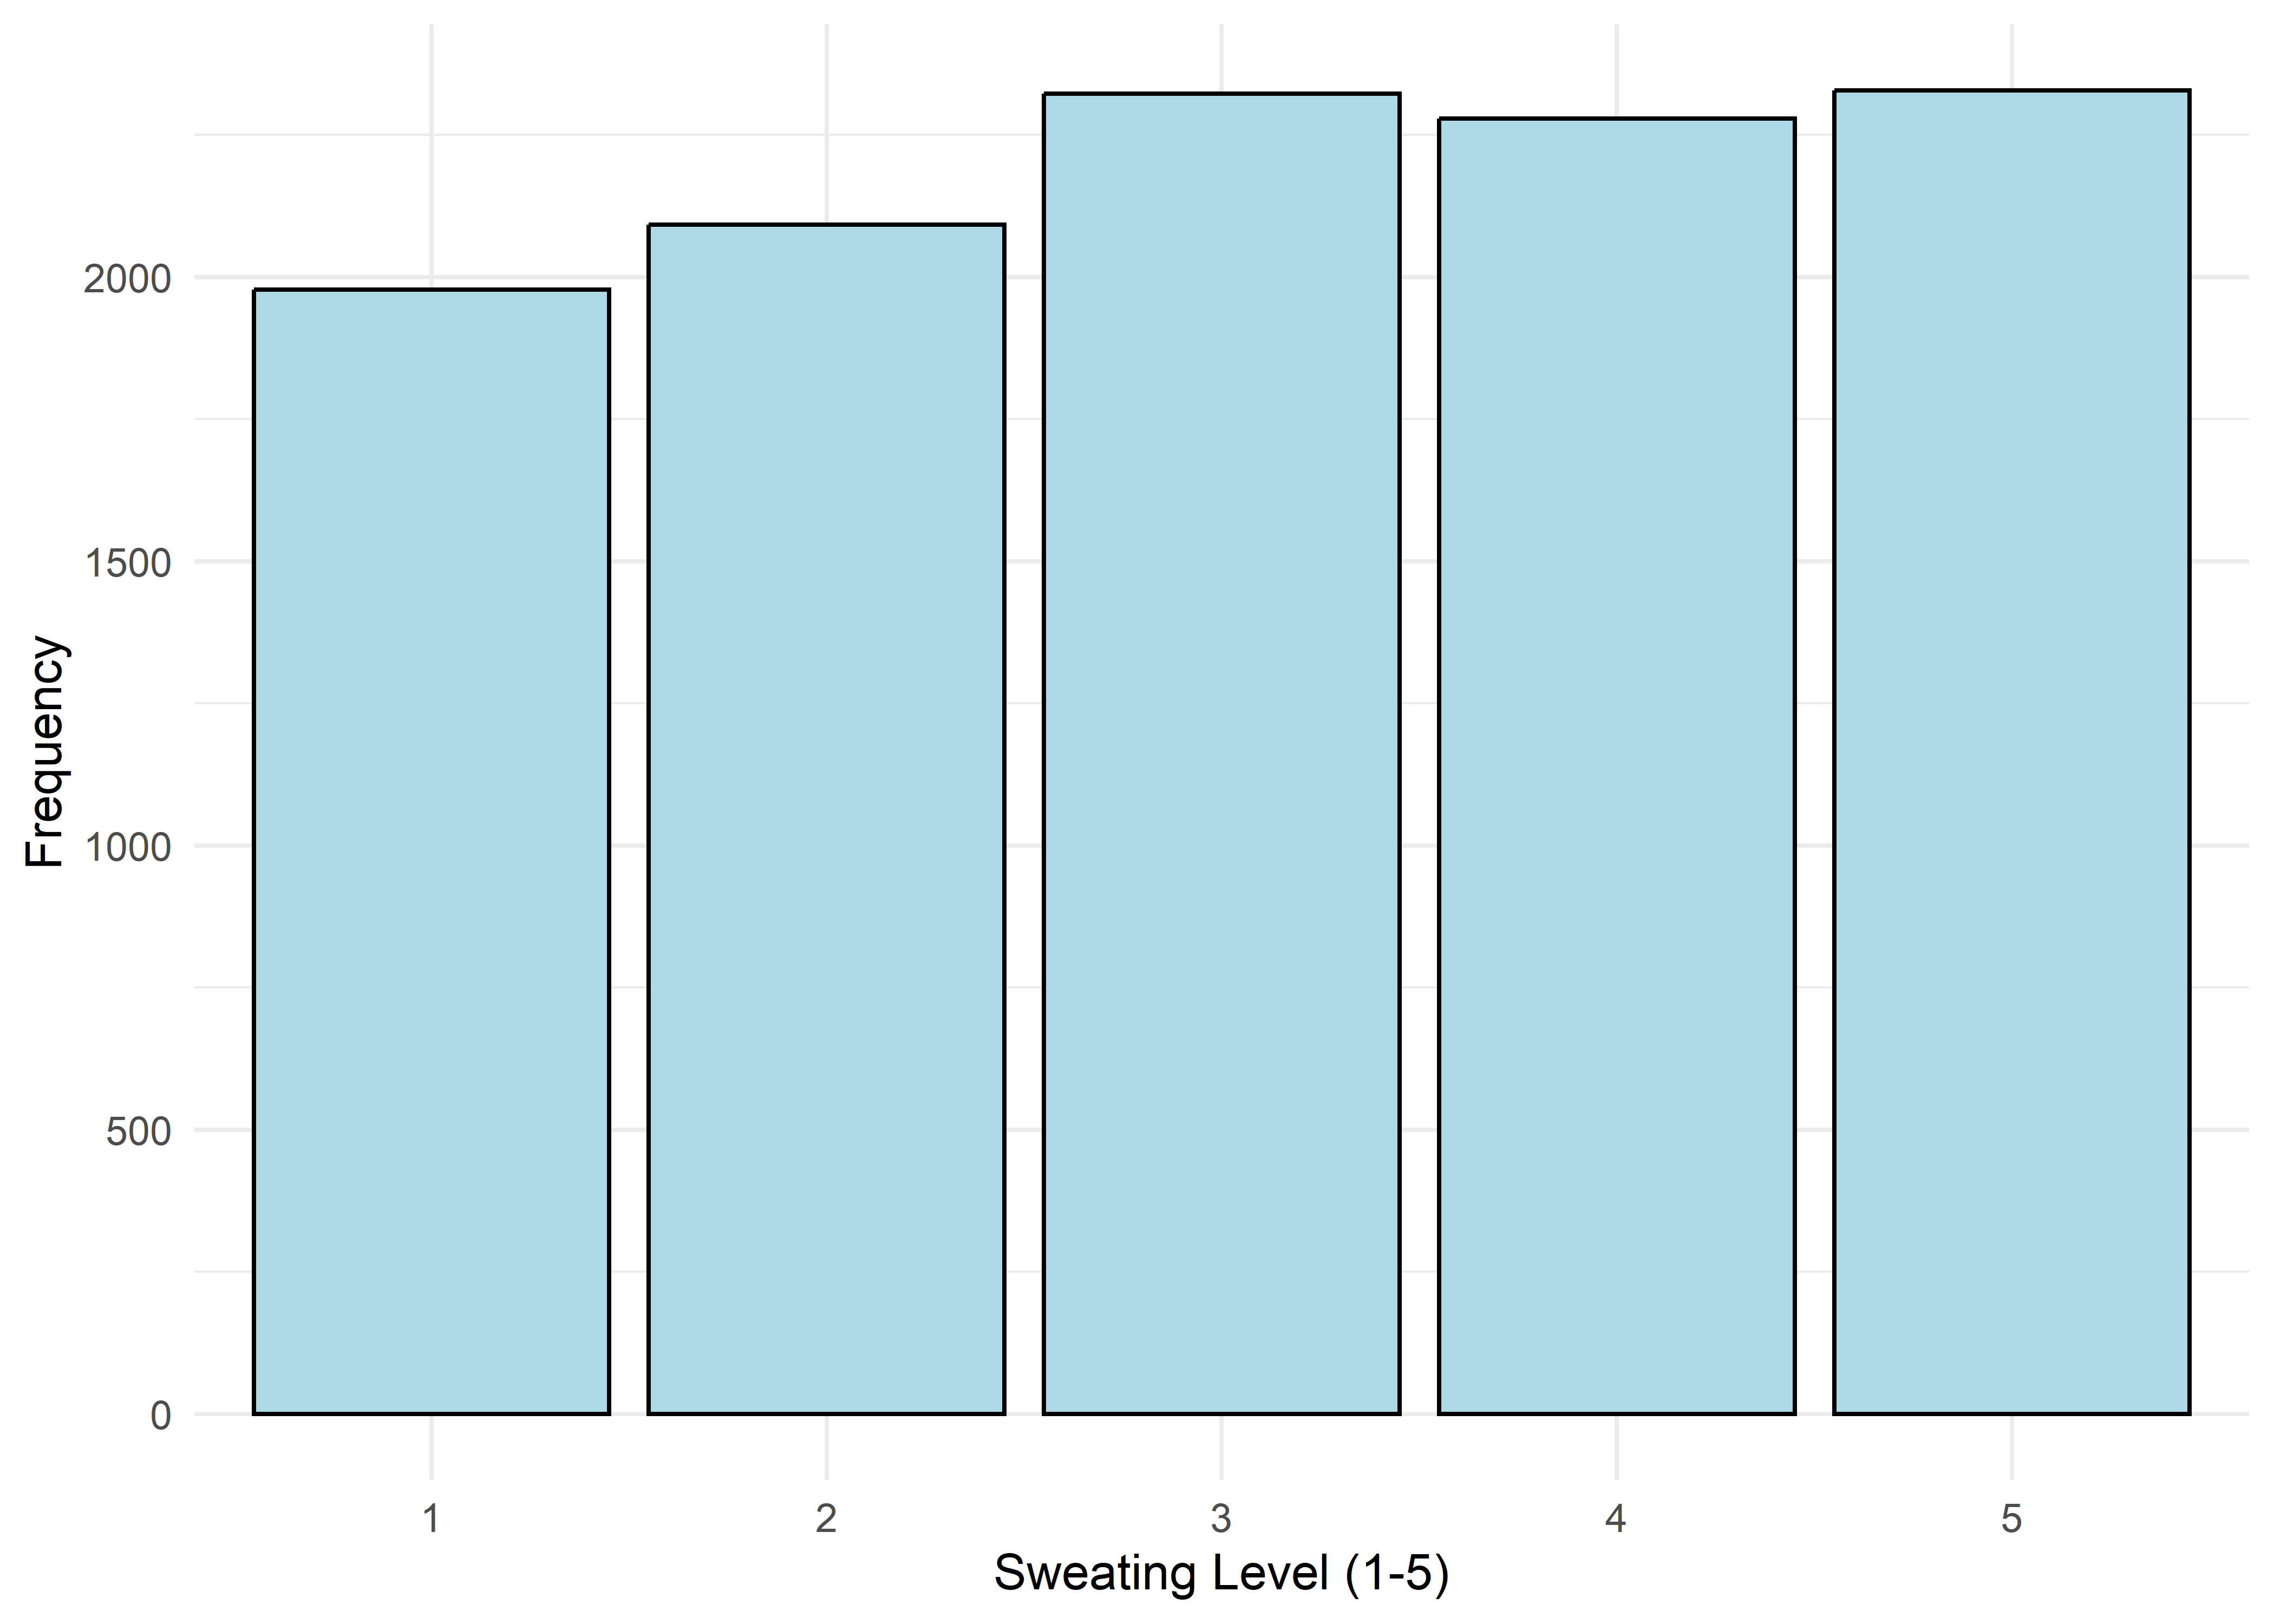
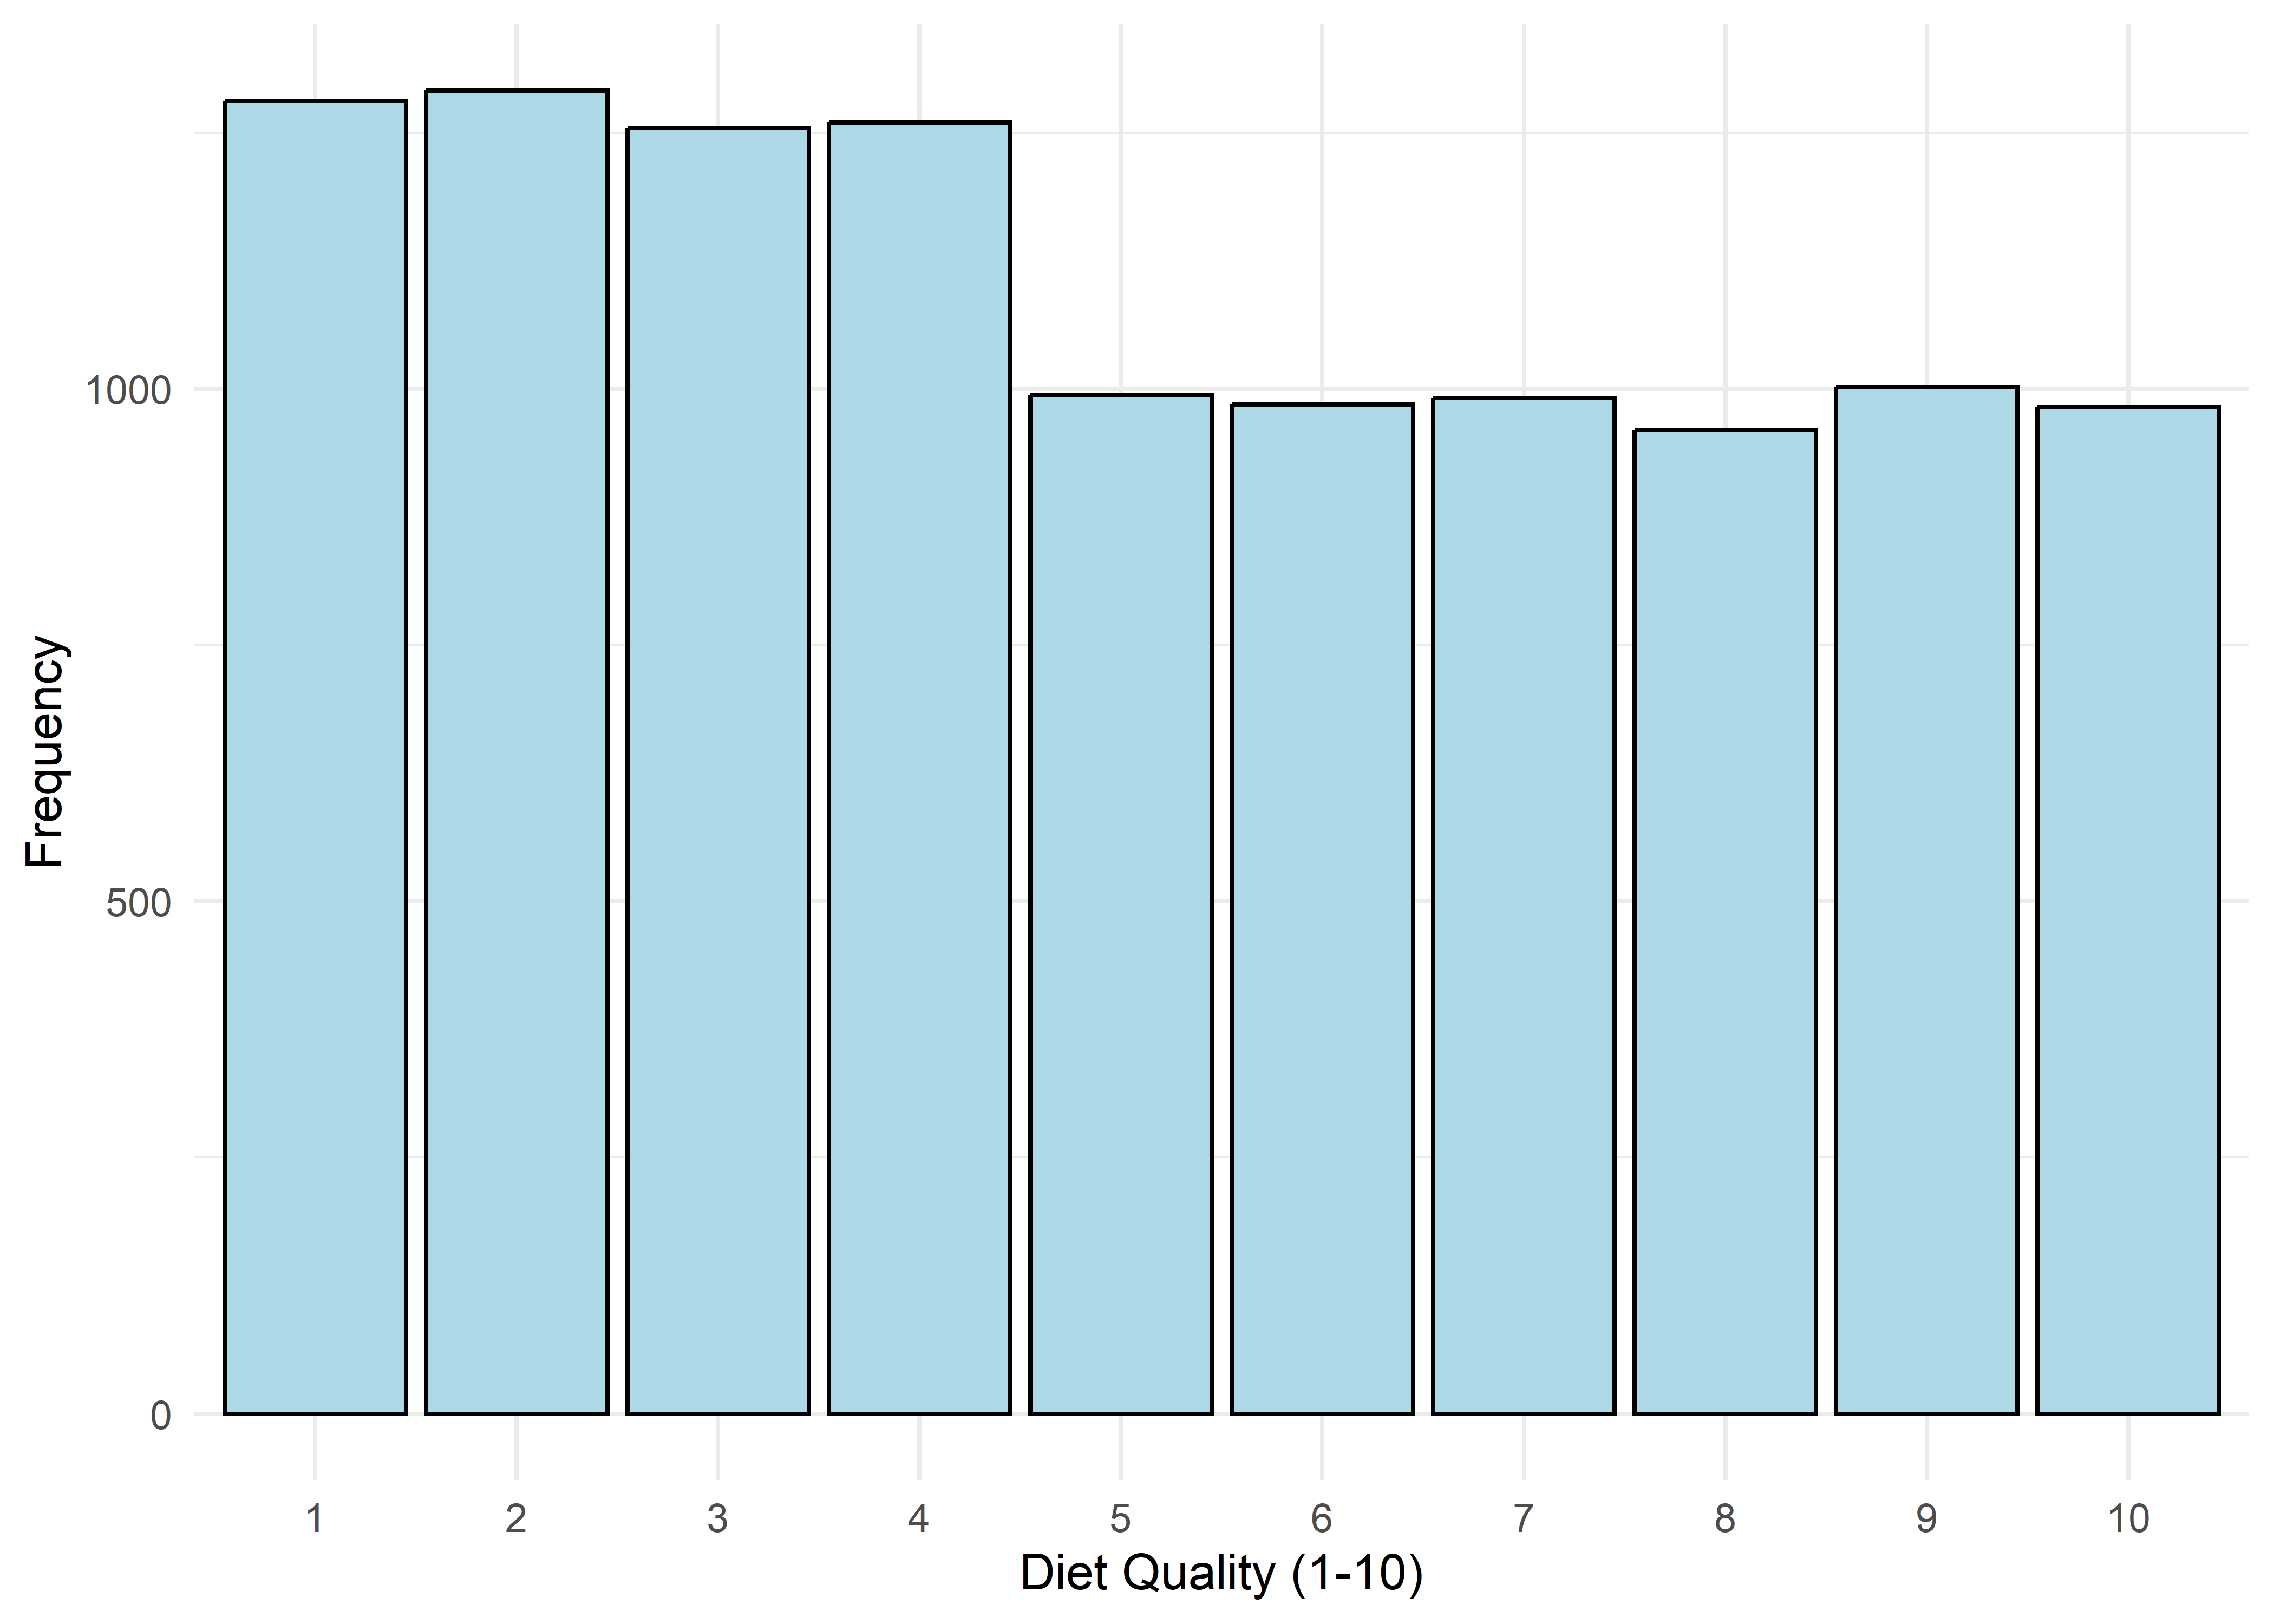
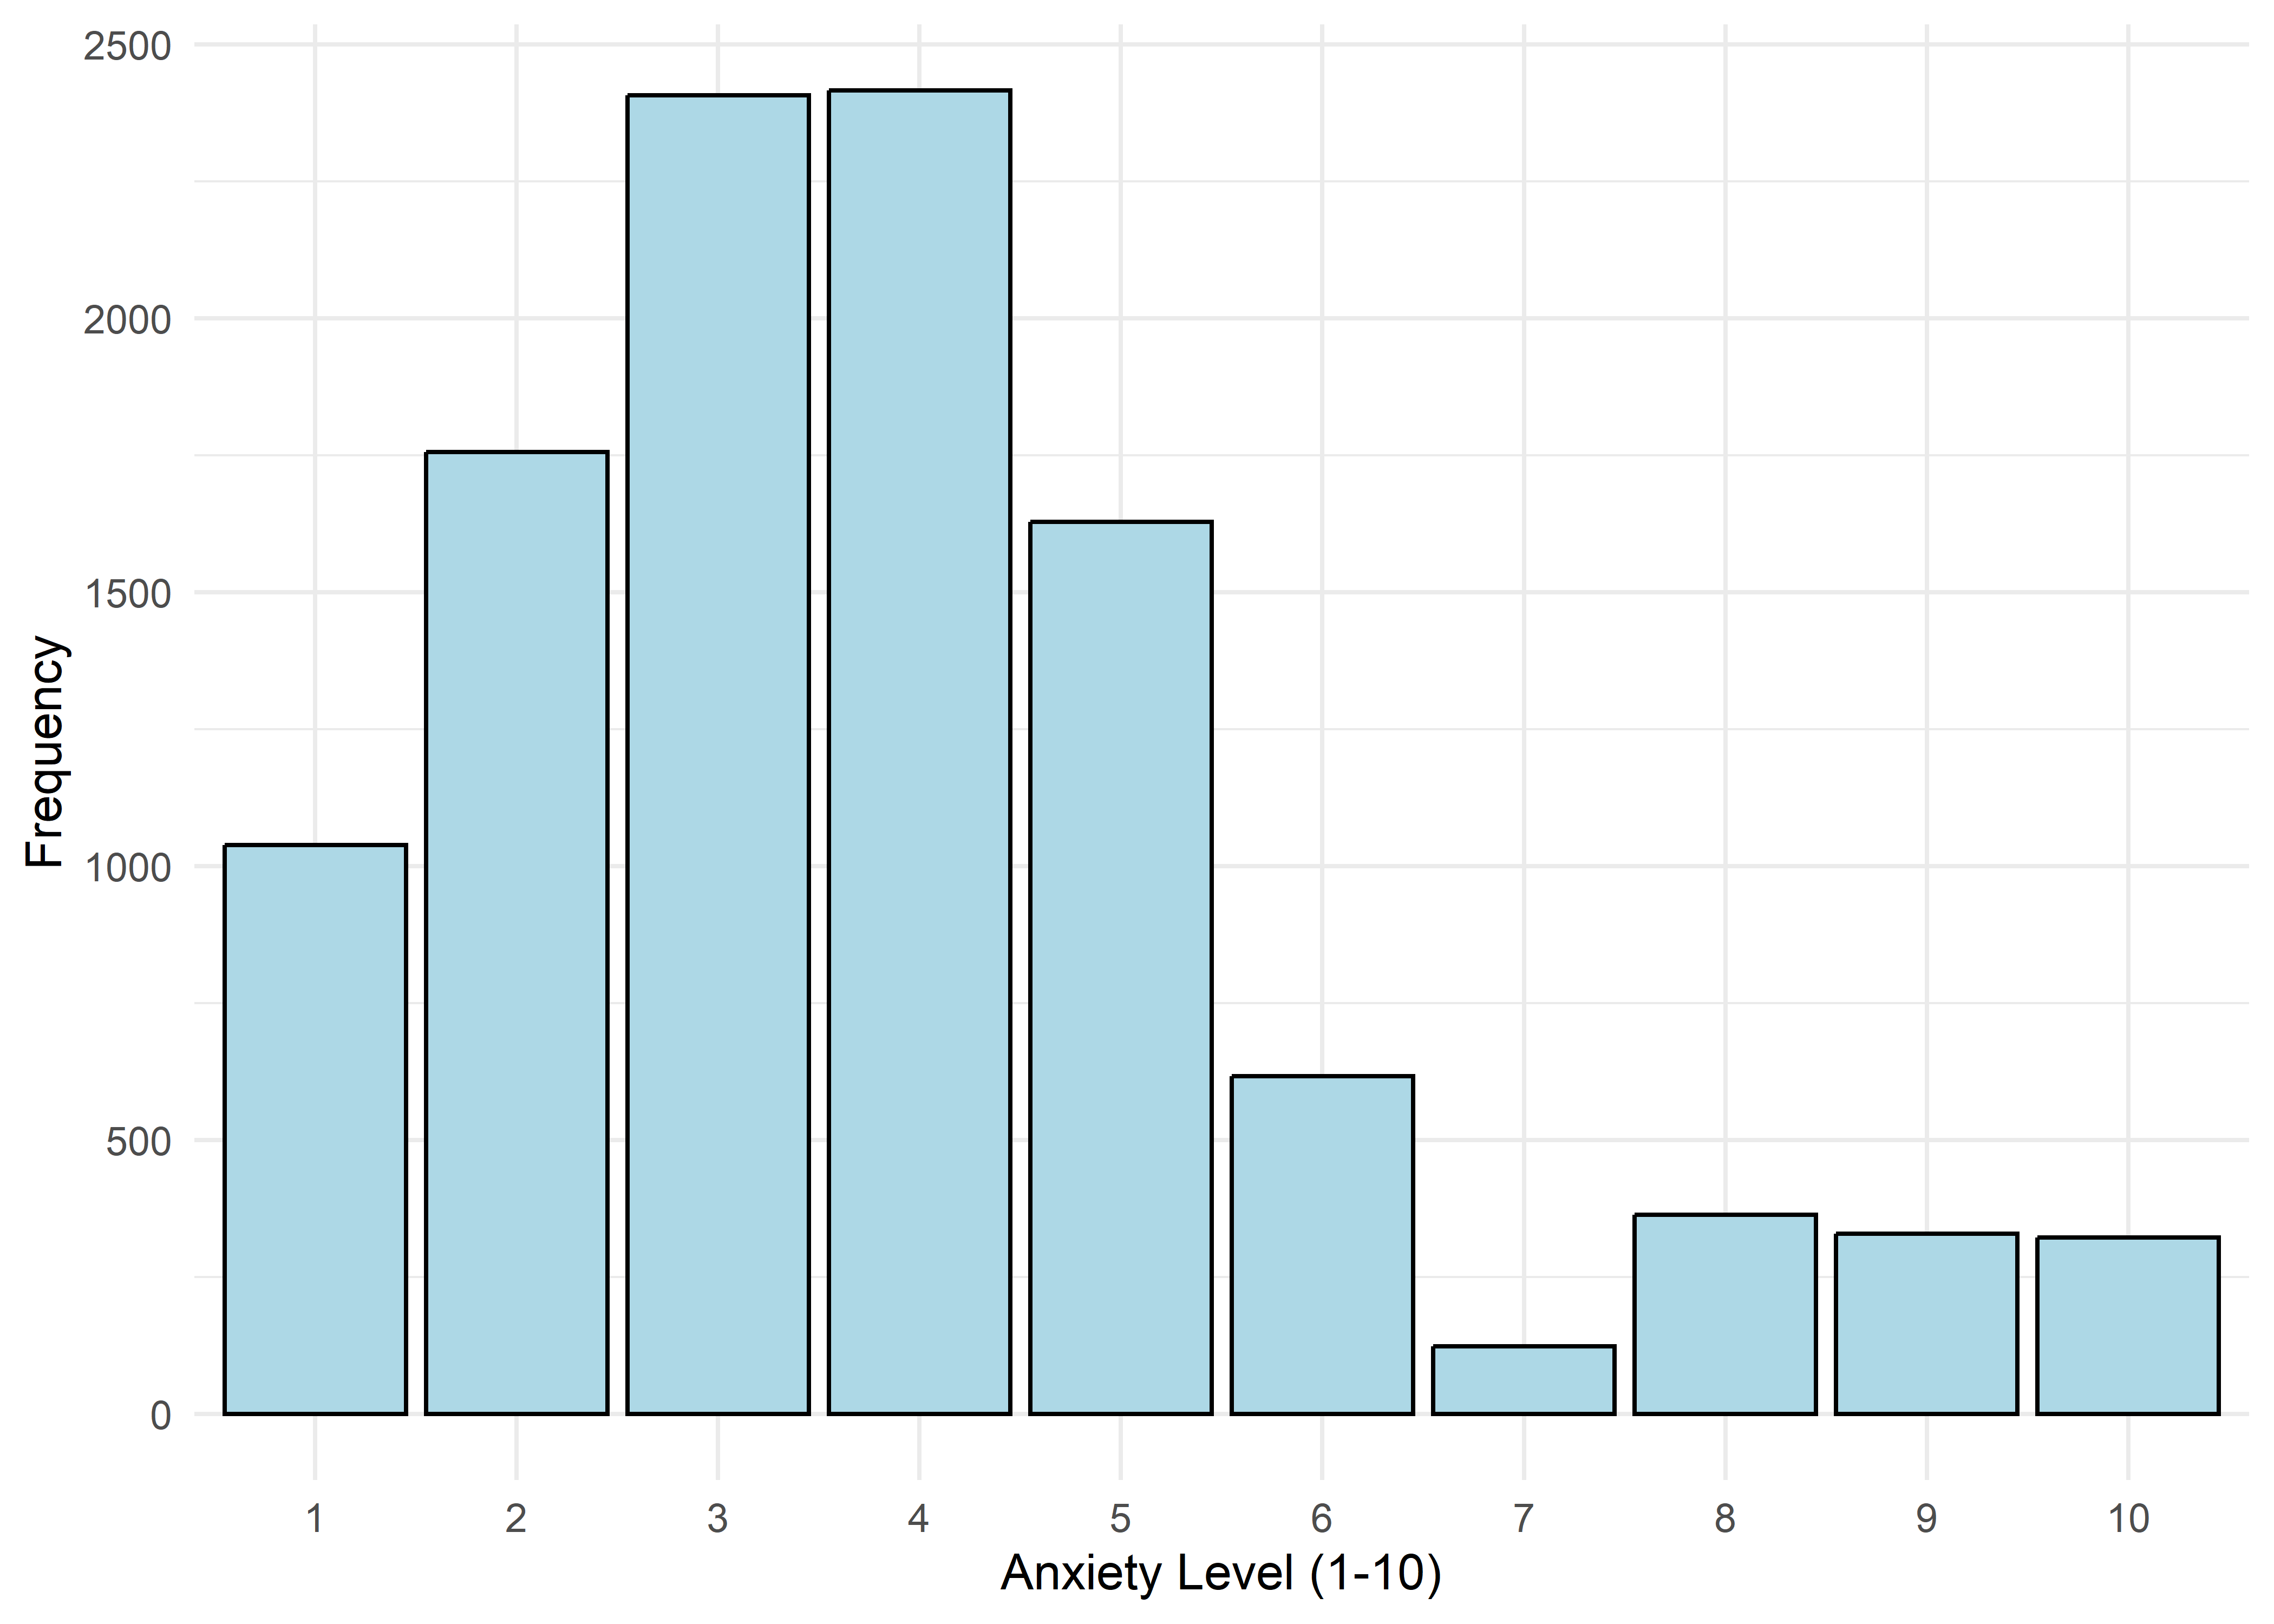
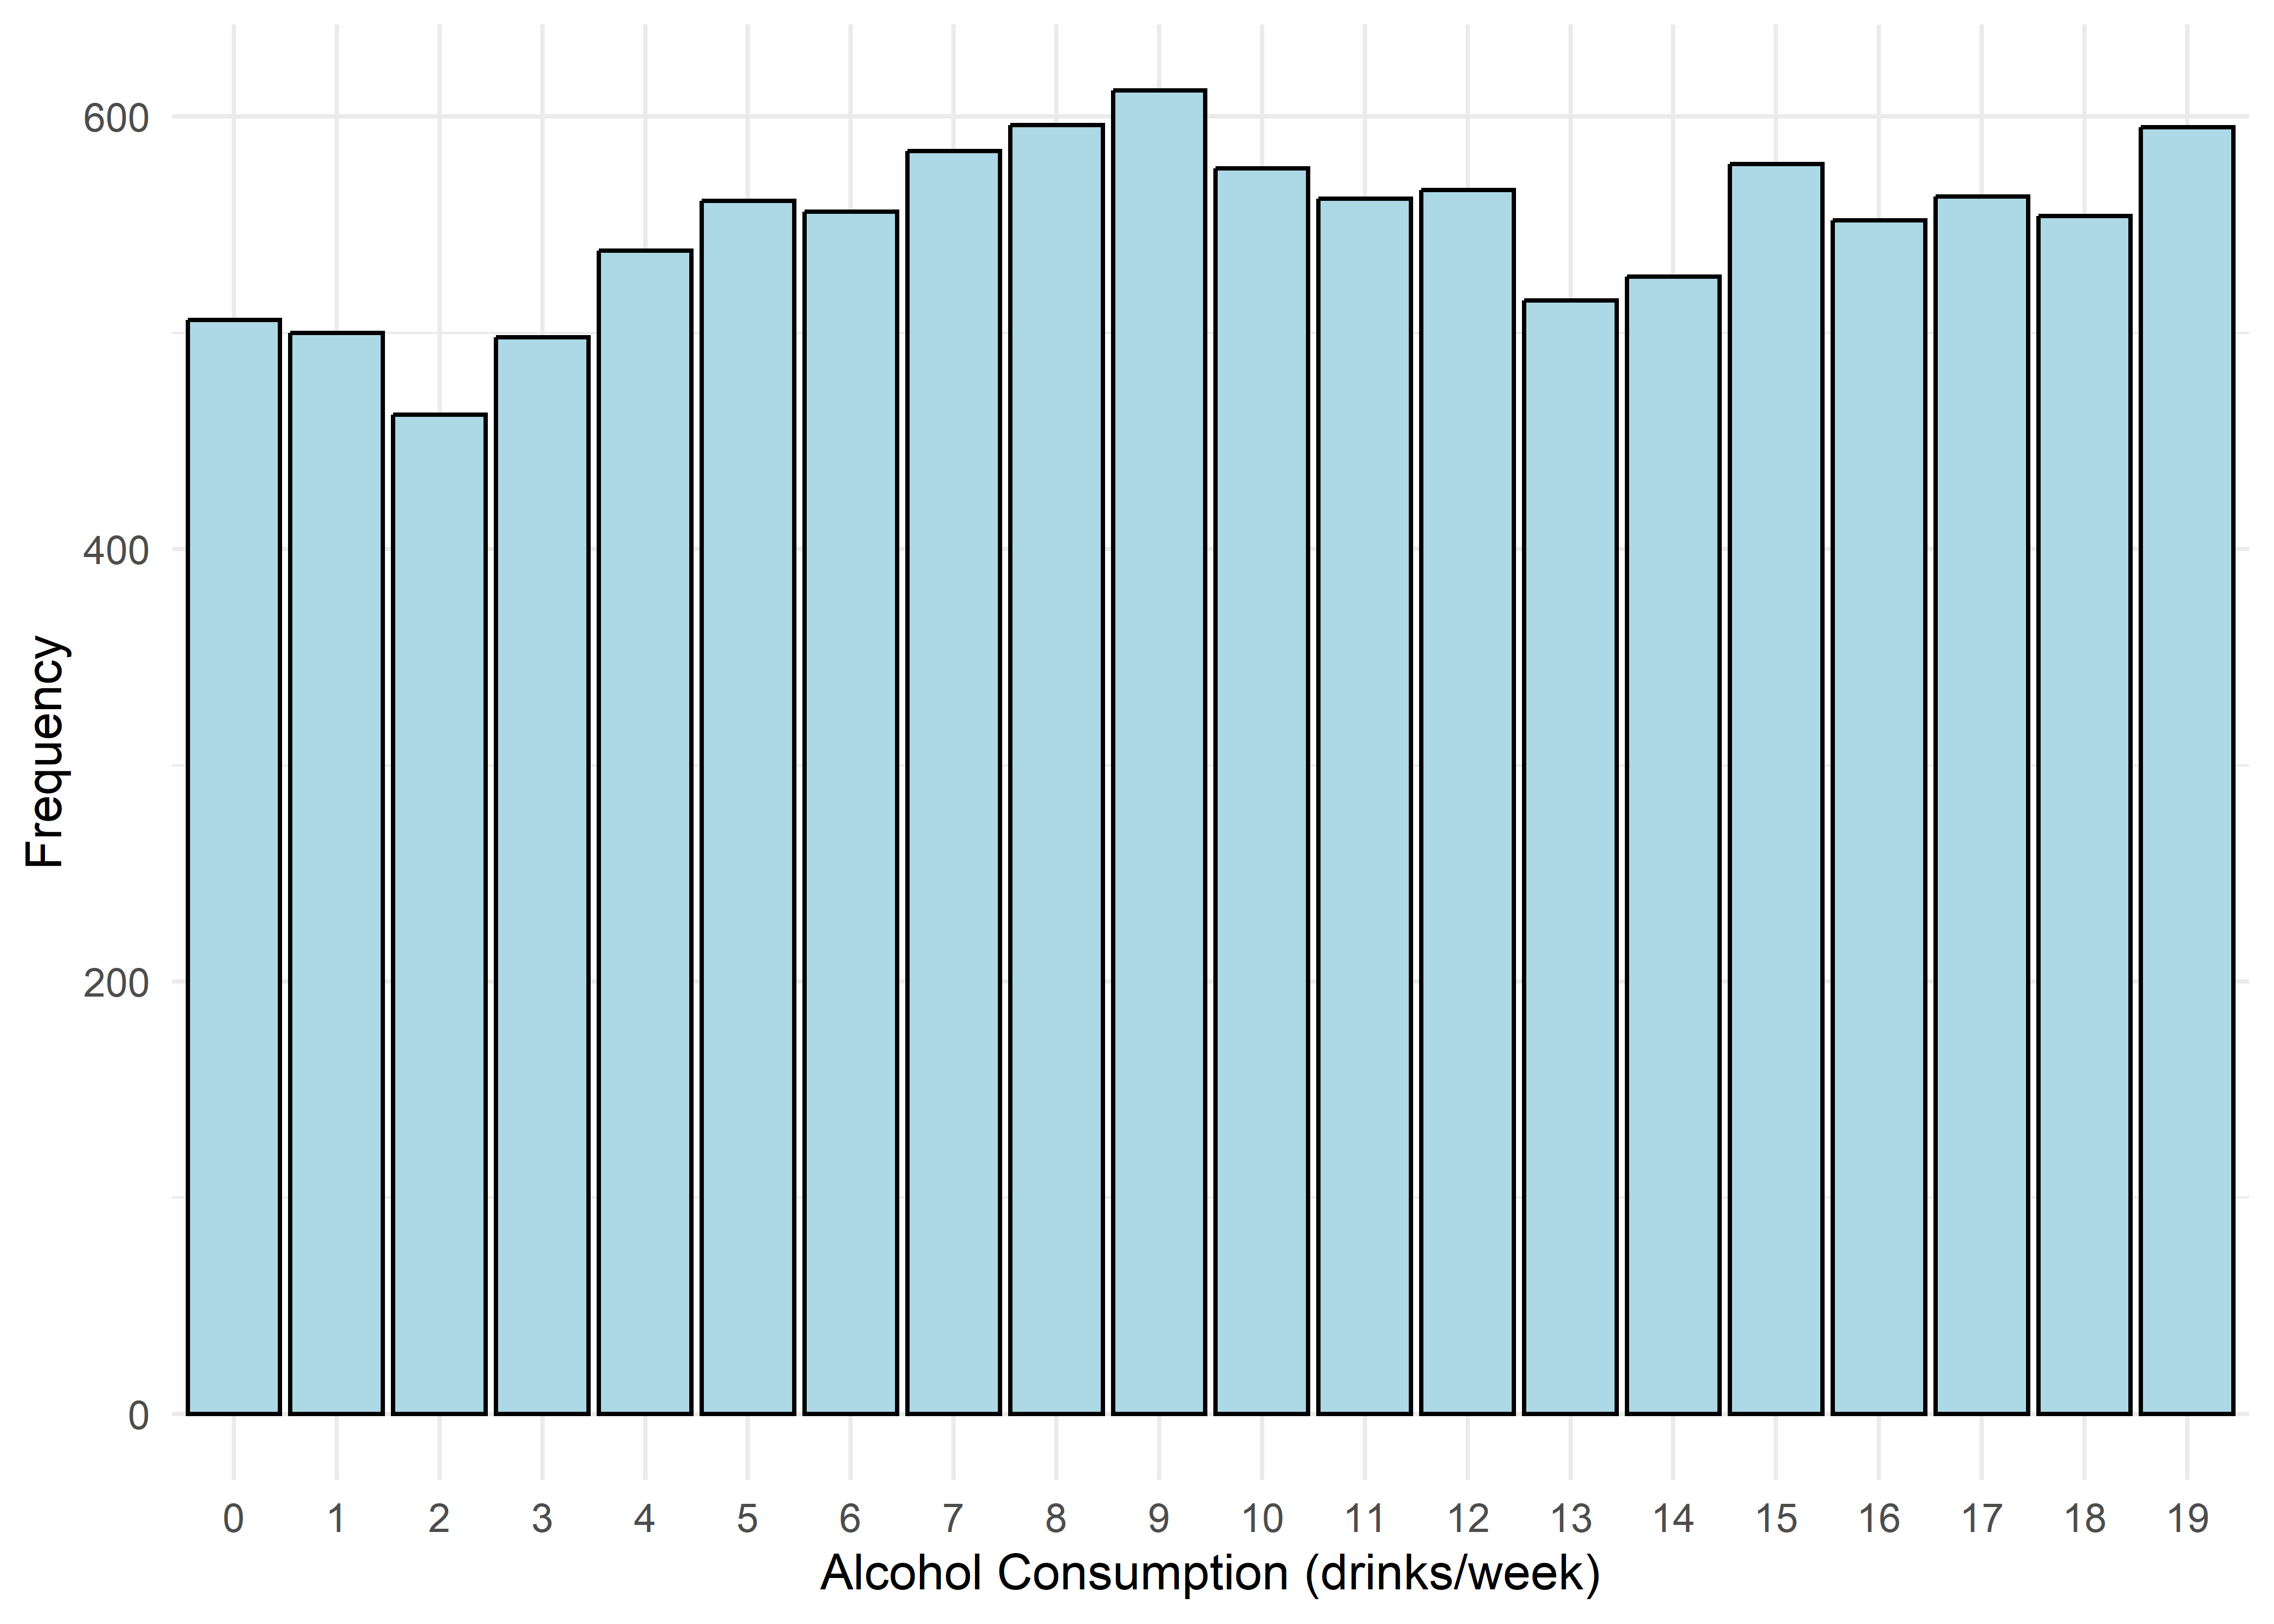
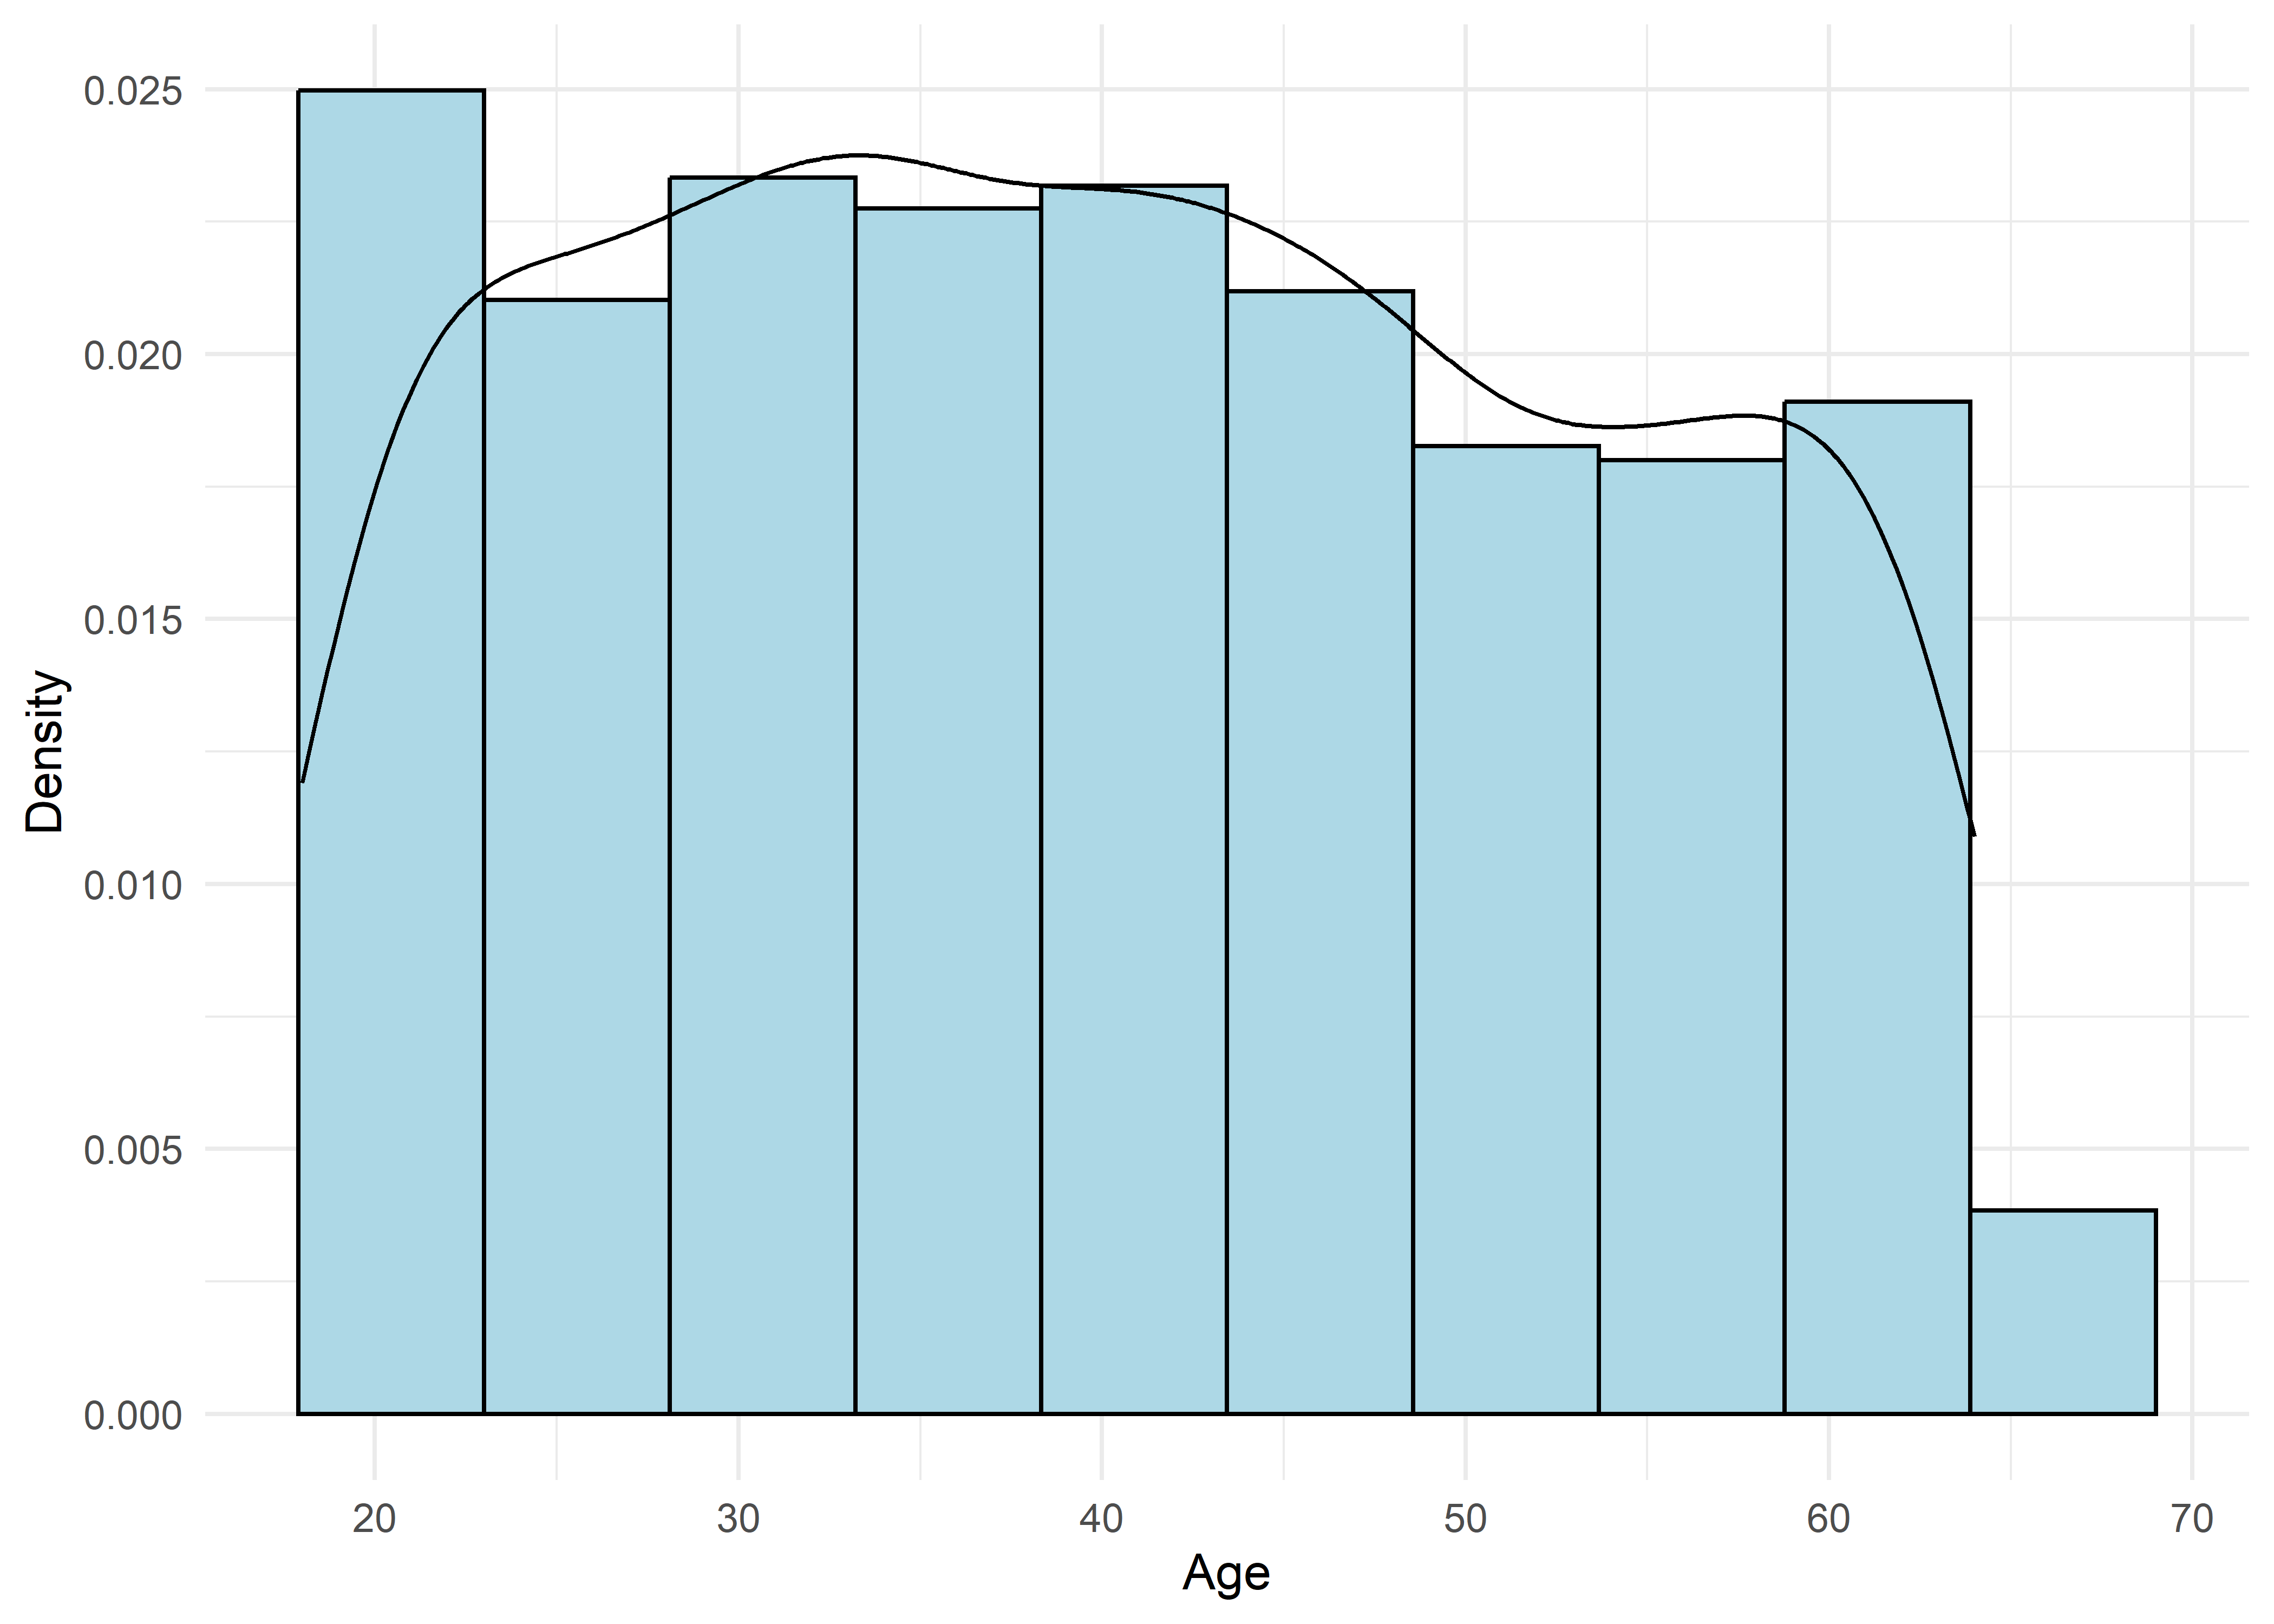
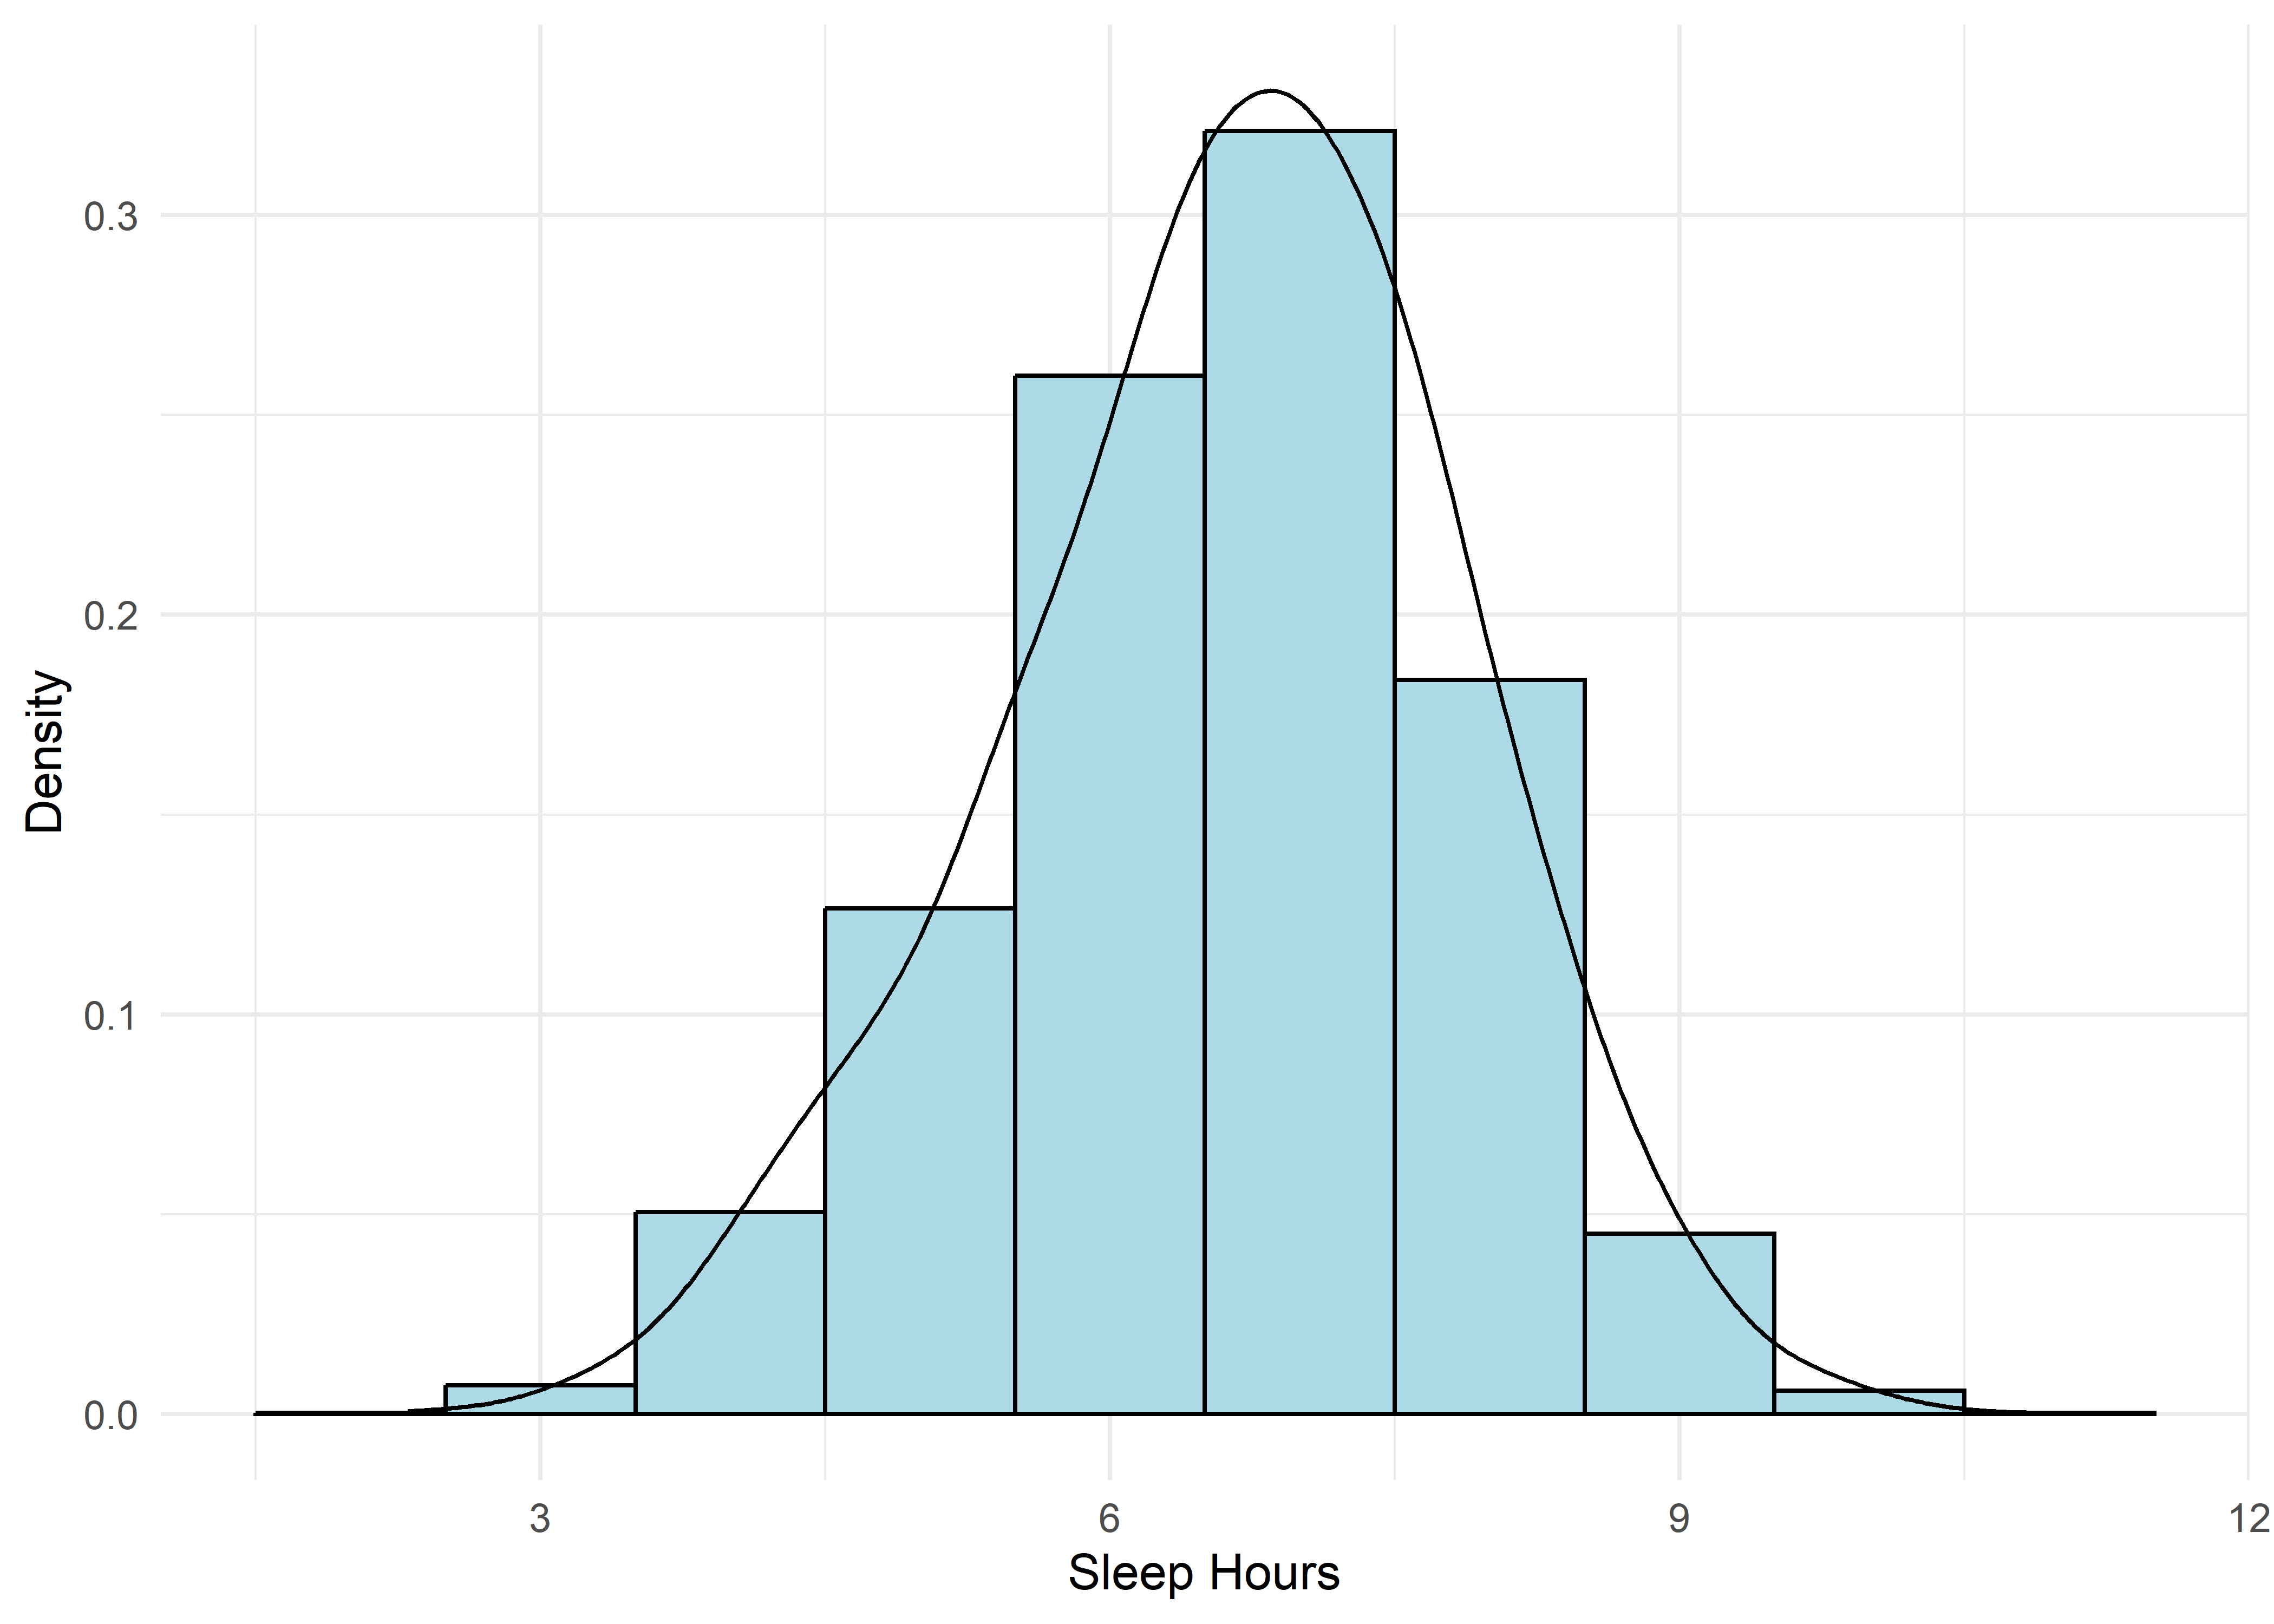
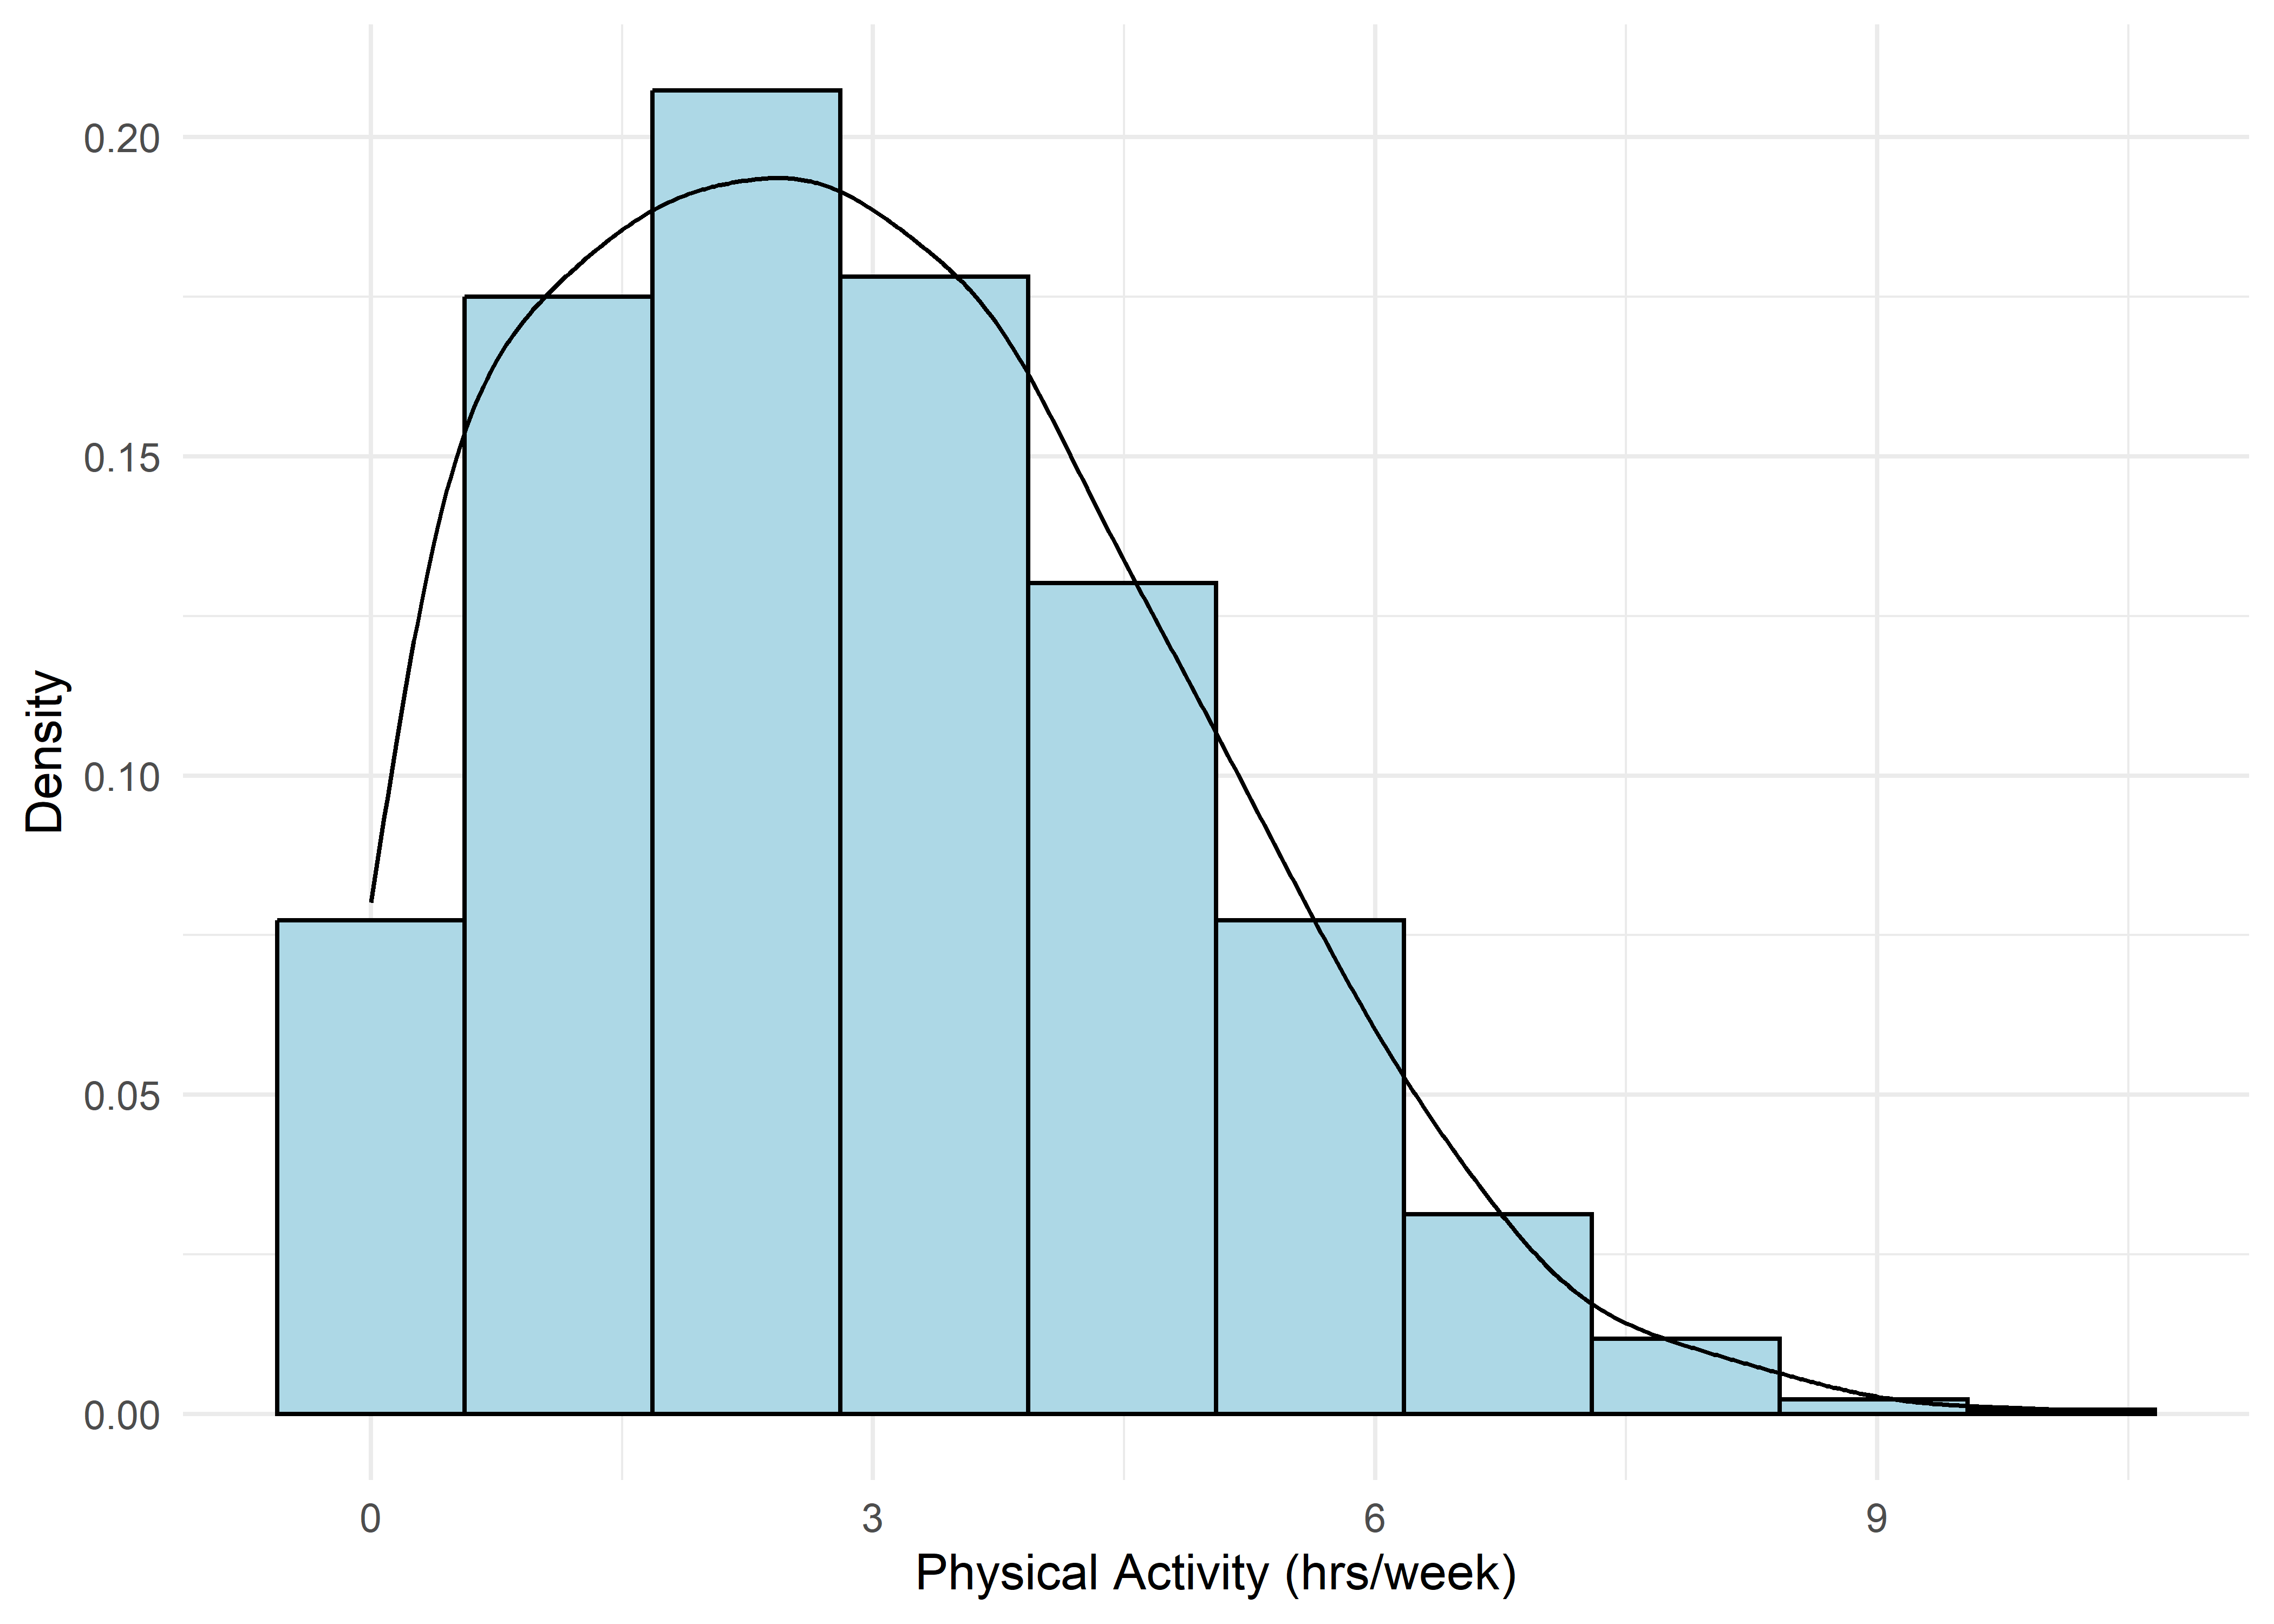
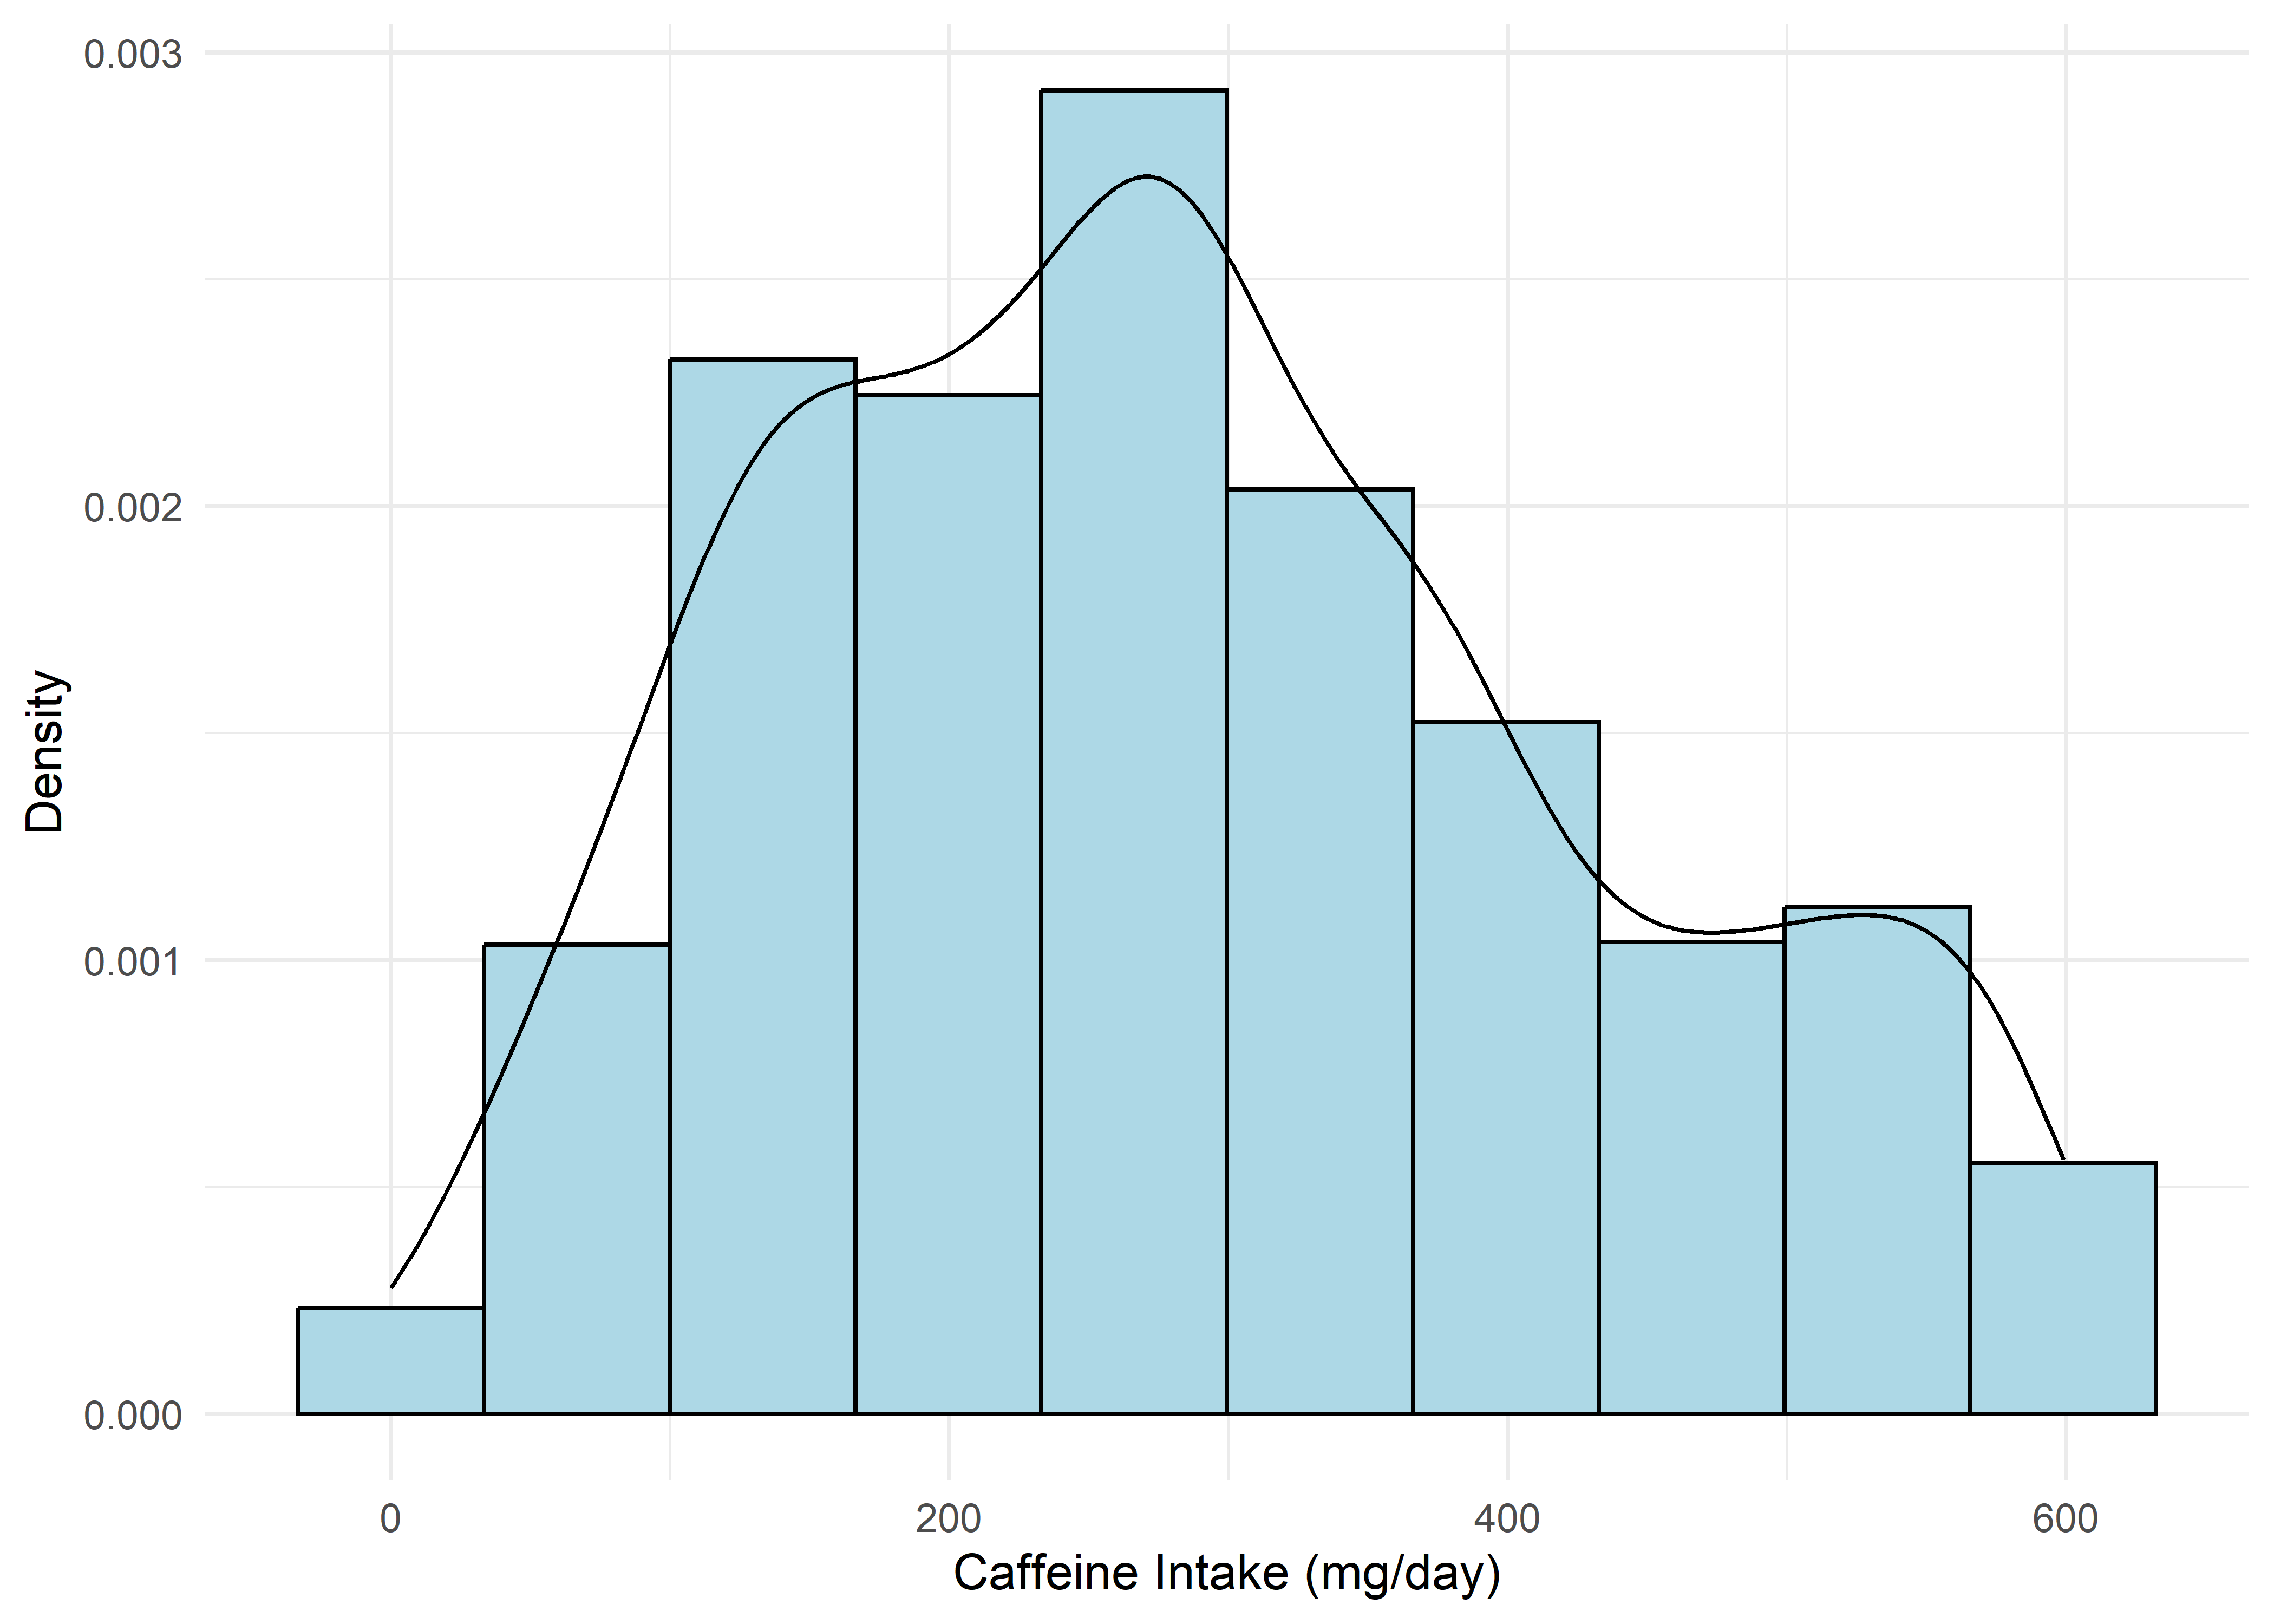
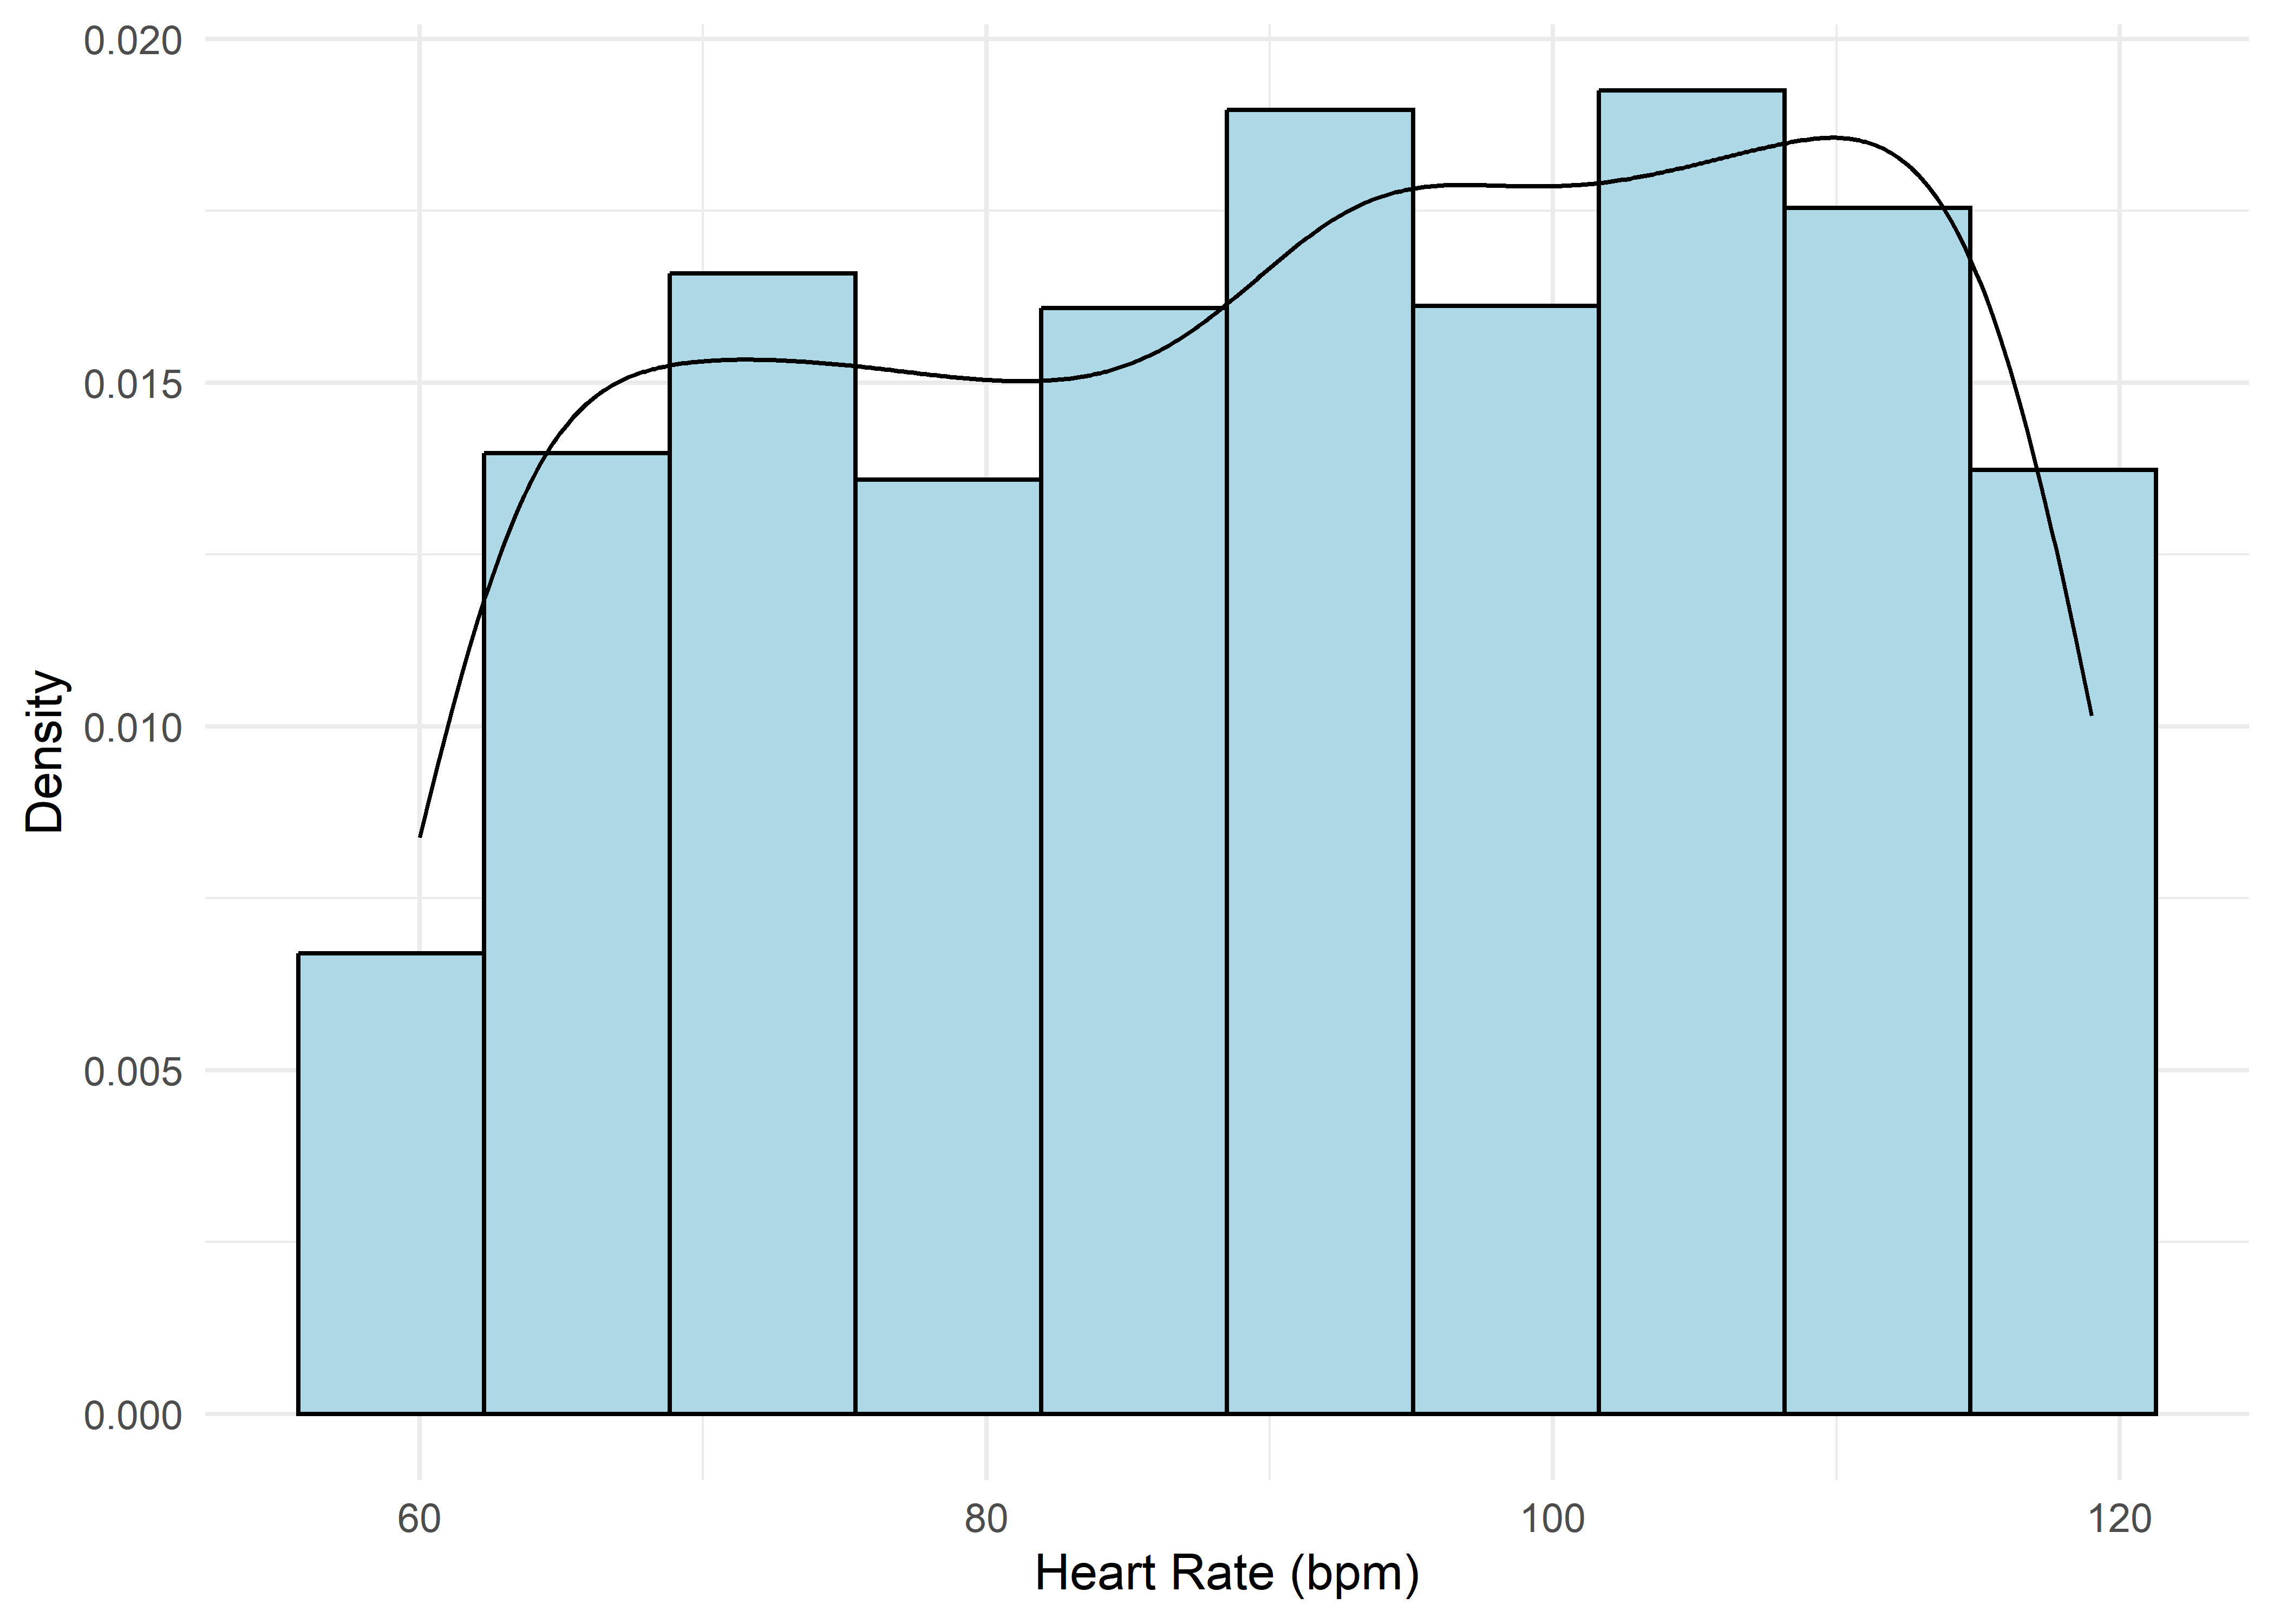
To guide univariate visualizations, predictors were grouped into five structural types: Categorical (Few), Categorical (Many), Ordinal, Discrete, and Continuous. Visualizations were matched accordingly—e.g., bar plots for discrete or ordinal variables, and histograms with overlaid density curves for continuous ones (10 bins, adjust = 1.5) to smooth sampling artifacts without distorting shape. This approach balances visual clarity with representational accuracy.
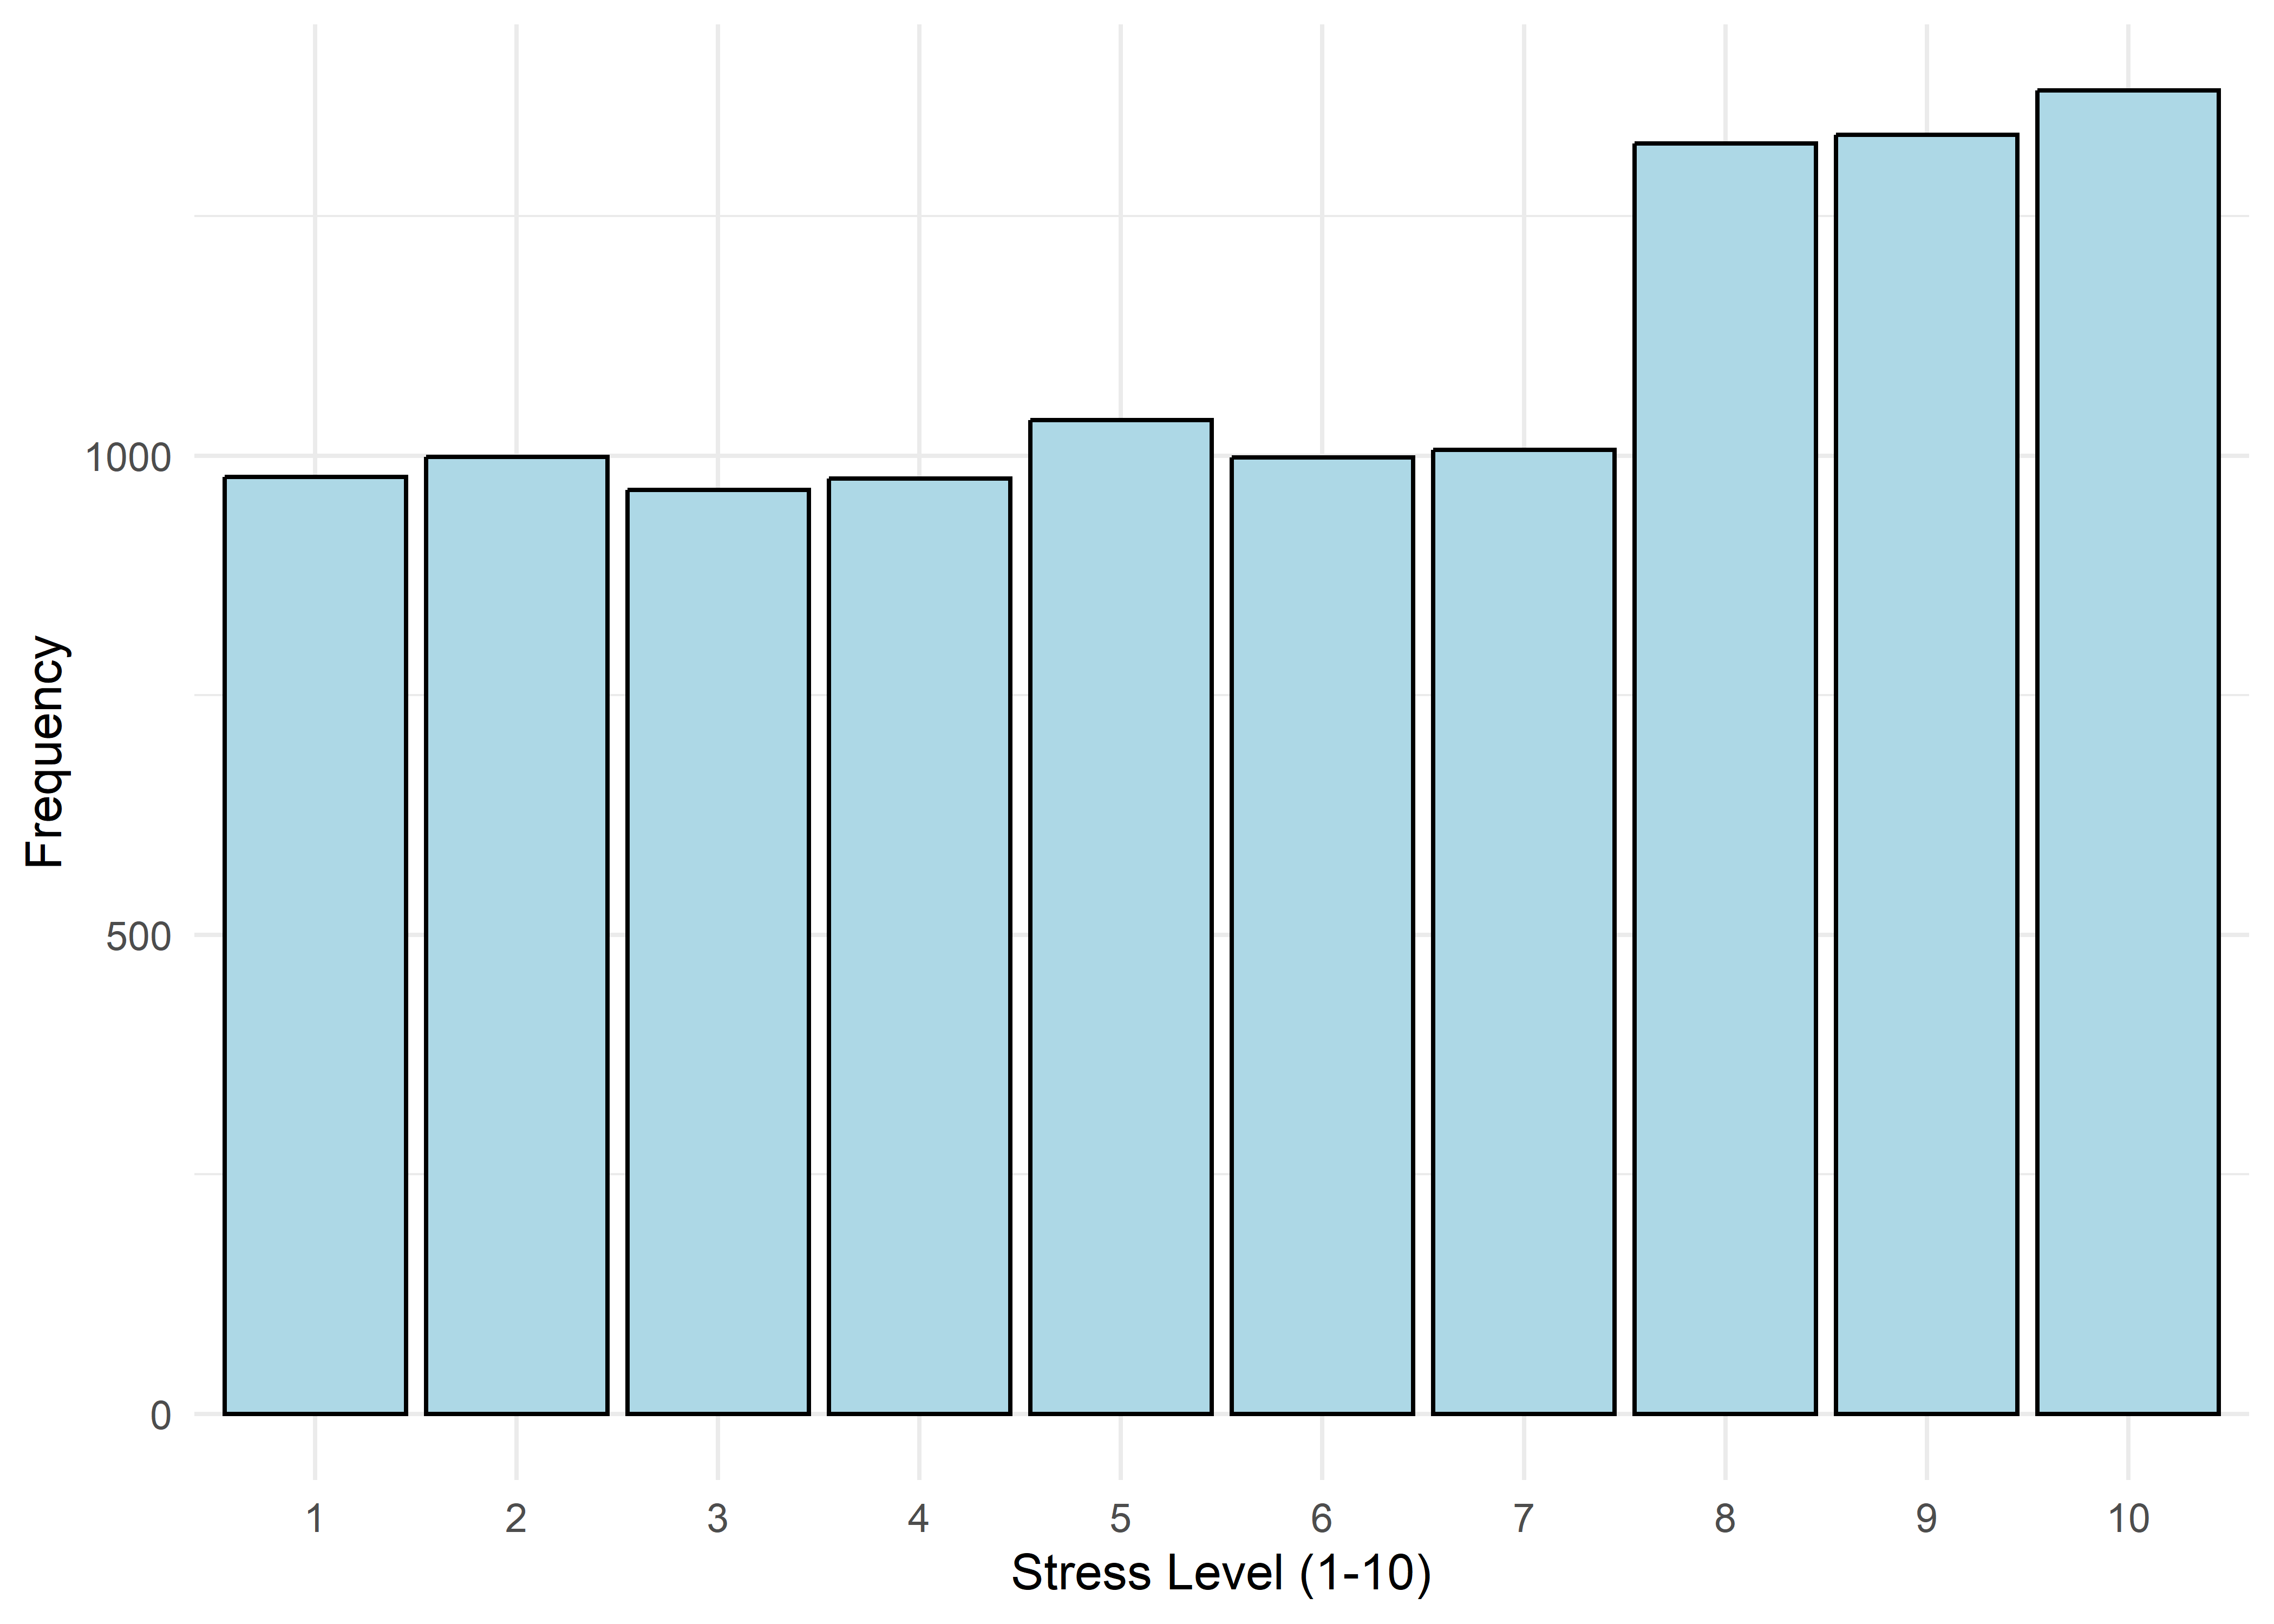
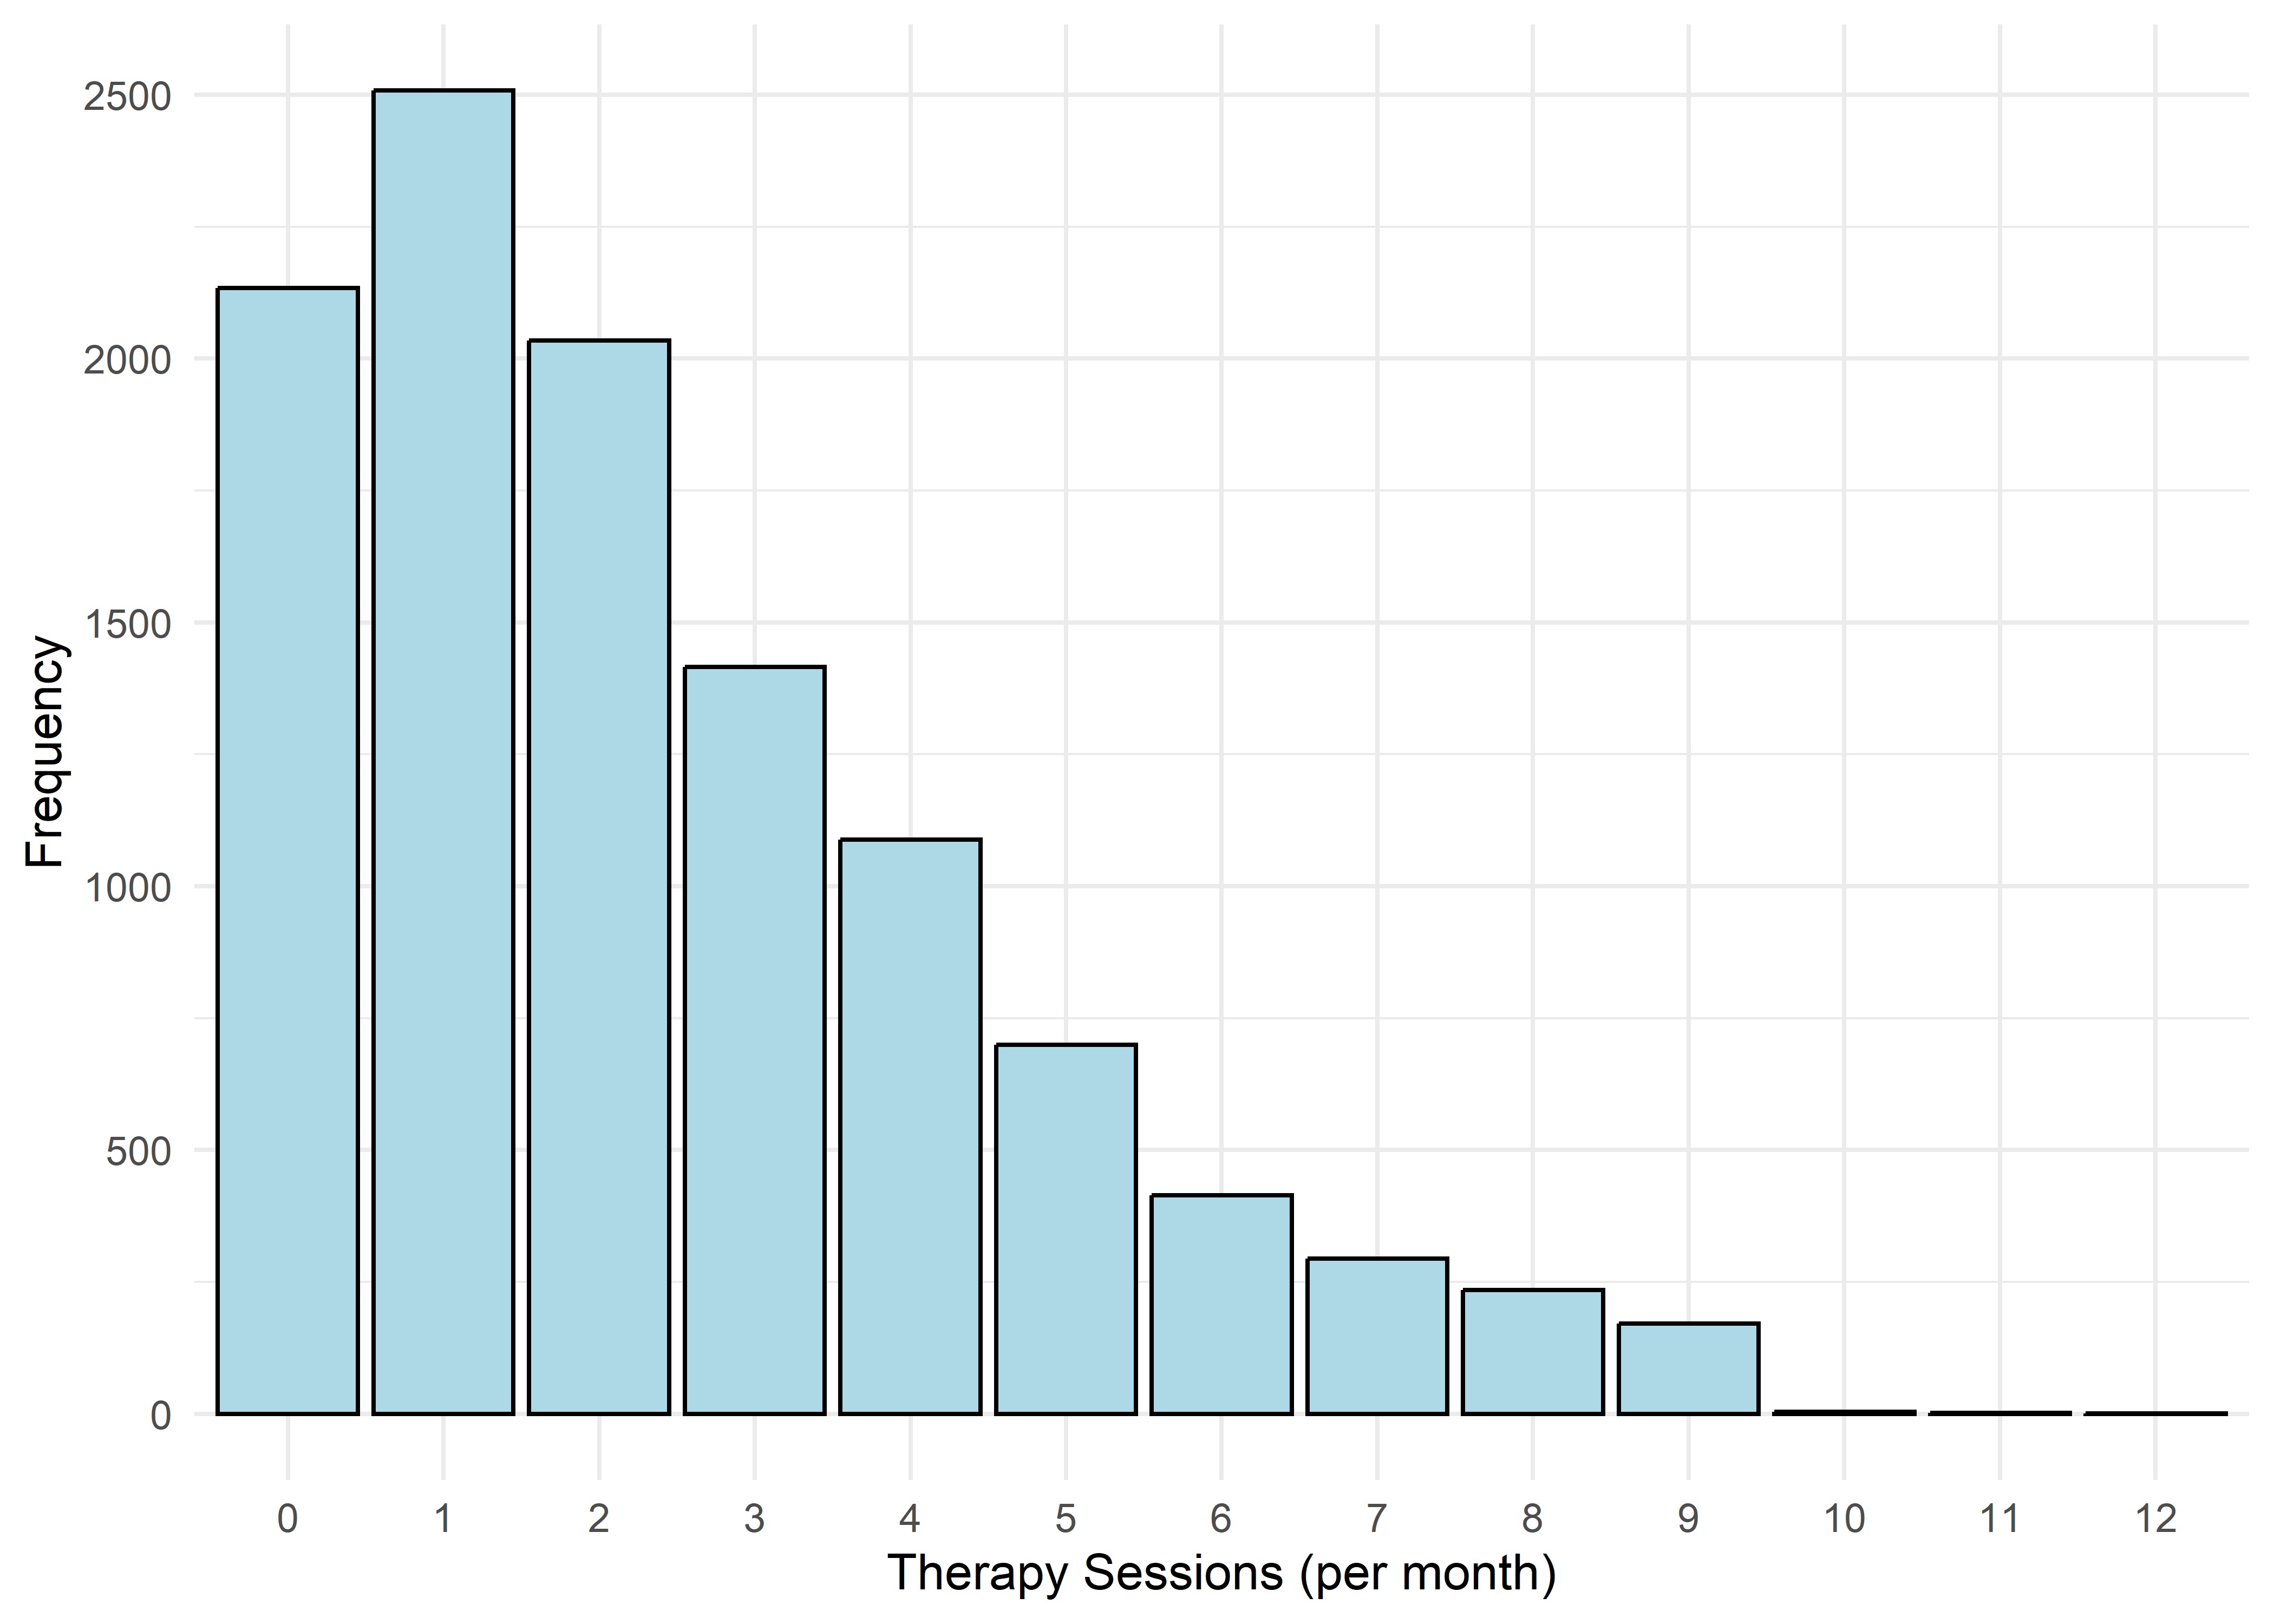
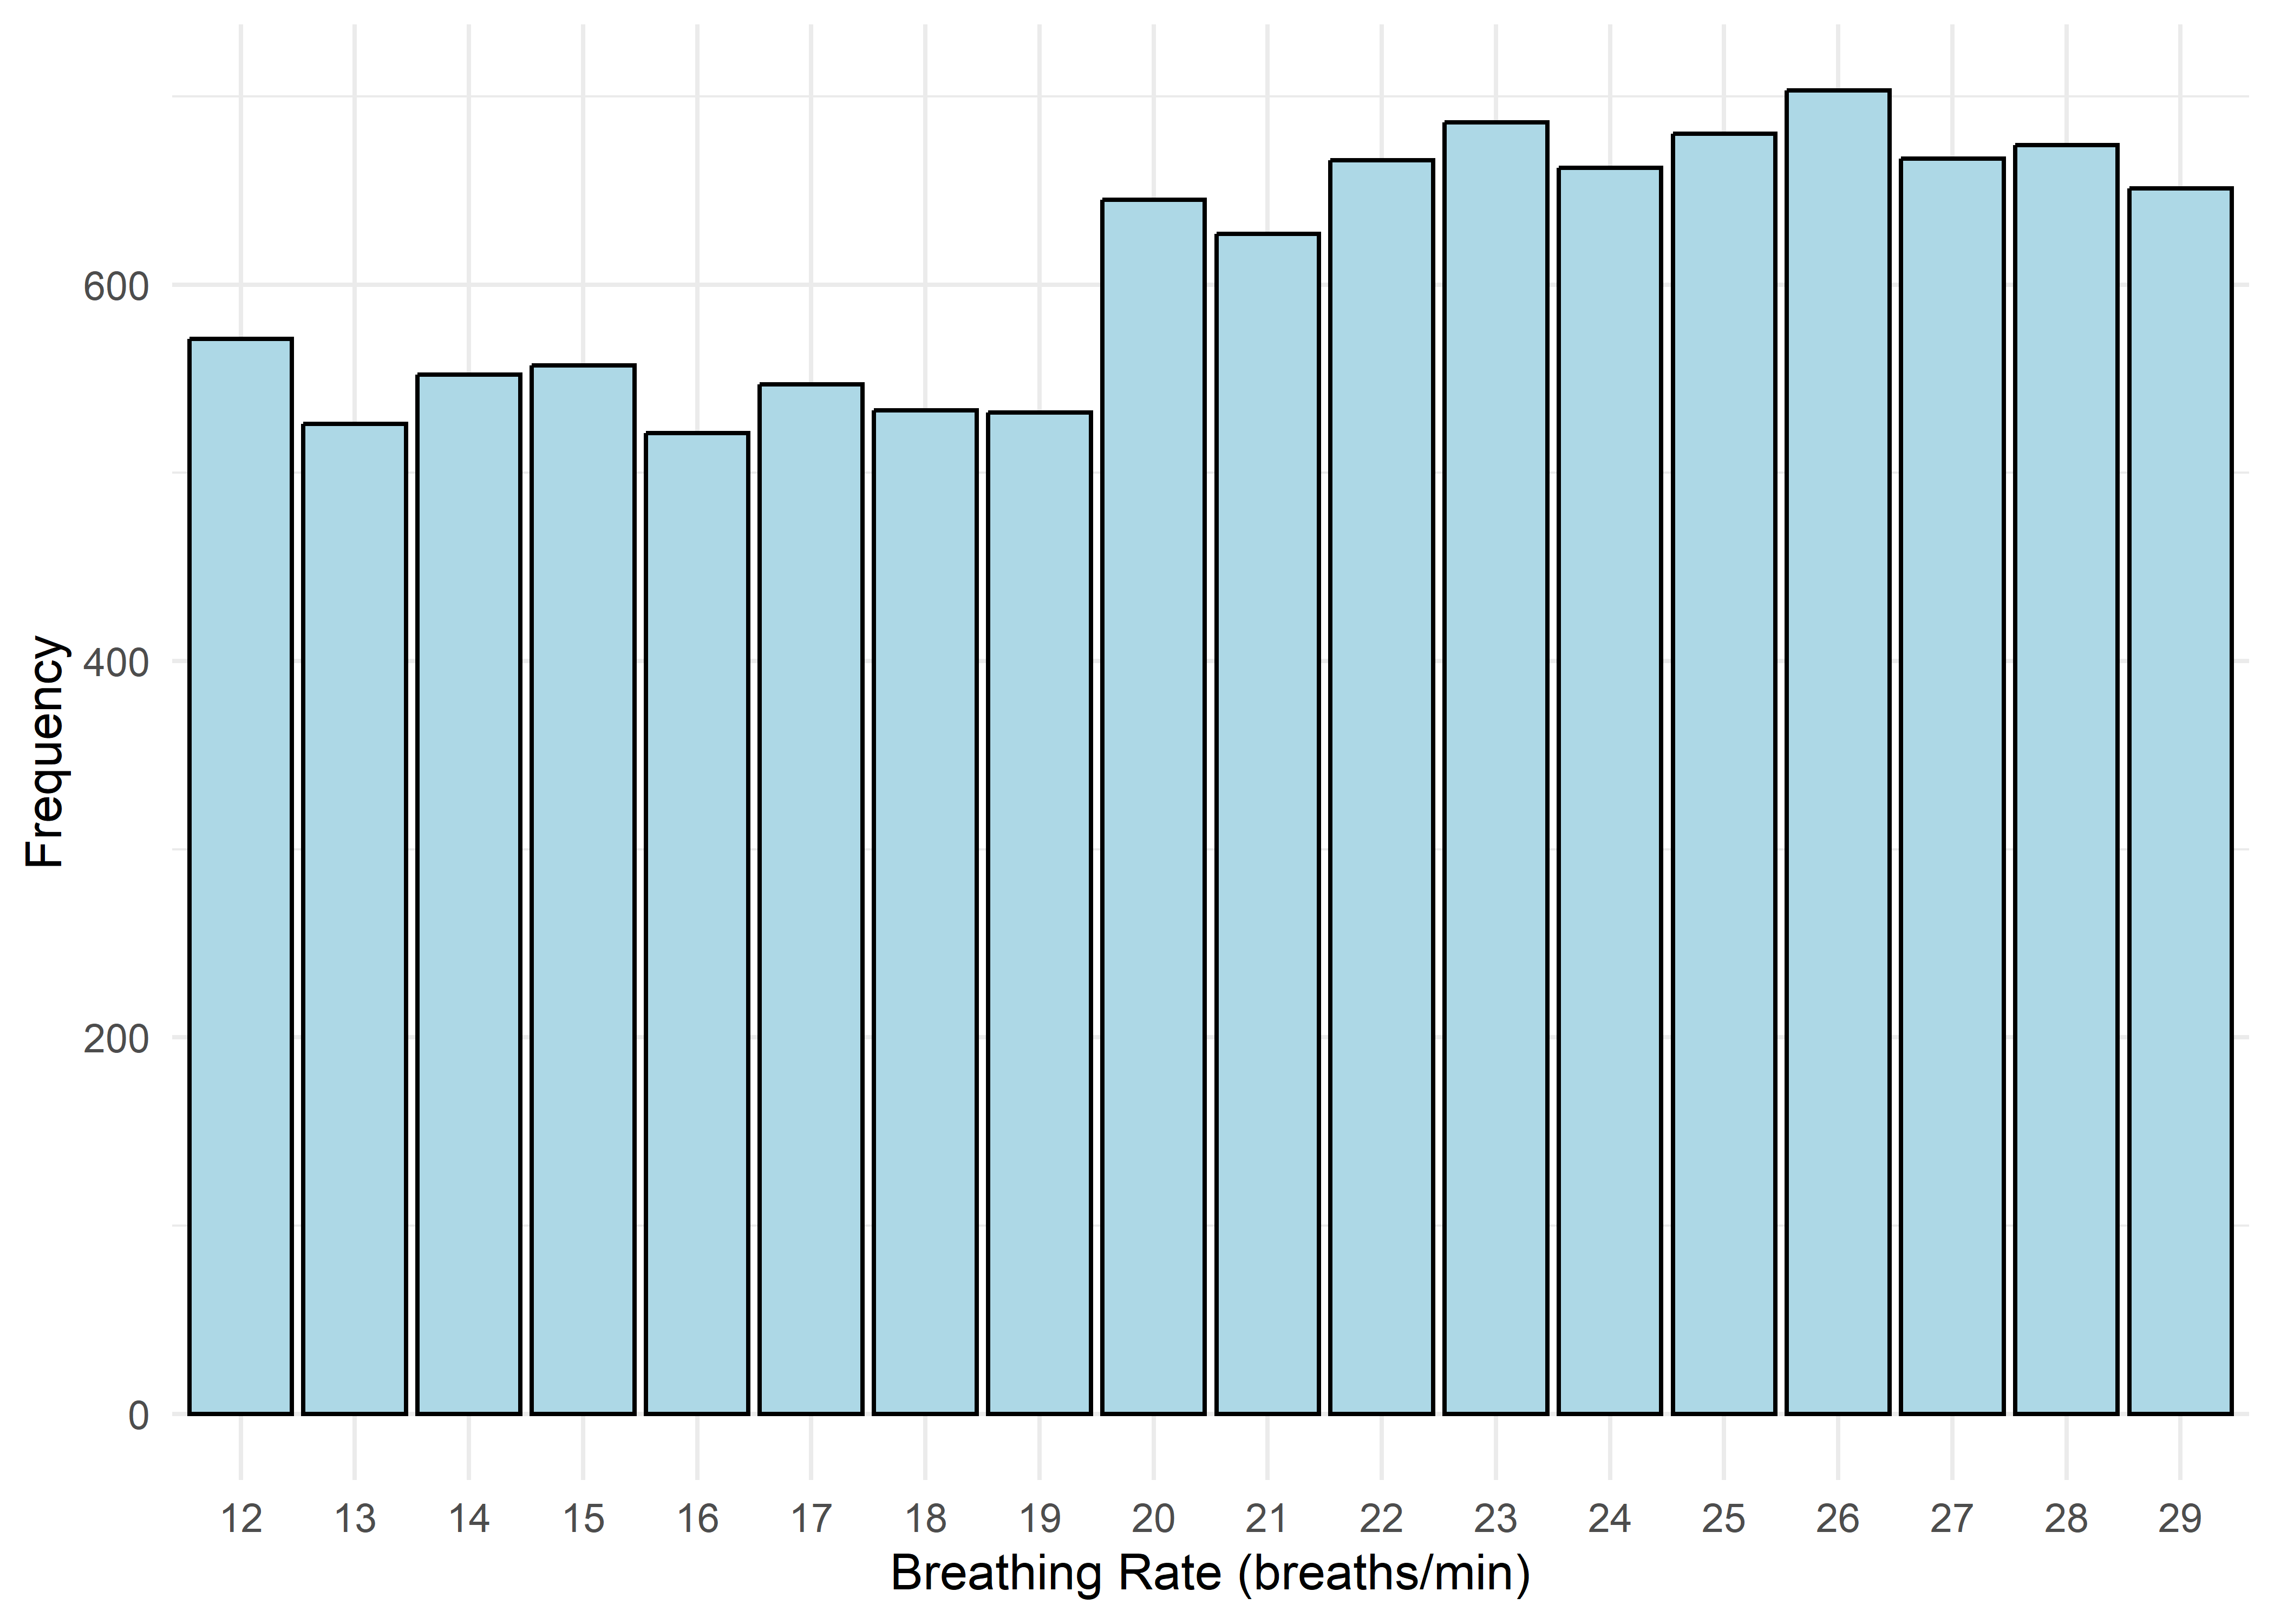
Most variables are roughly uniform or flat. Notable exceptions include Sleep Hours (approximately normal), Caffeine Intake (slightly left-skewed), and Physical Activity and Therapy Sessions (strongly right-skewed, which may hint towards log transformation when modeling). Anxiety Level, while also right-skewed, is treated as an ordinal response and shouldn’t be transformed.
Use the dropdown below to explore each variable’s distribution and summary statistics interactively.
Anxiety Level vs Other Variable Plots
To explore how each variable relates to the response variable Anxiety Level (1–10), we selected visualization strategies matched to variable type. While ordinal, Anxiety Level can flexibly be treated as categorical or numeric depending on context. For example, heatmaps were used for ordinal/discrete pairs, while continuous predictors were paired with boxplots, and categorical variables with bar or density plots. These choices maximize interpretability, particularly given the discrete nature of anxiety ratings.
Use the dropdown below to explore each variable’s distribution and summary statistics interactively.
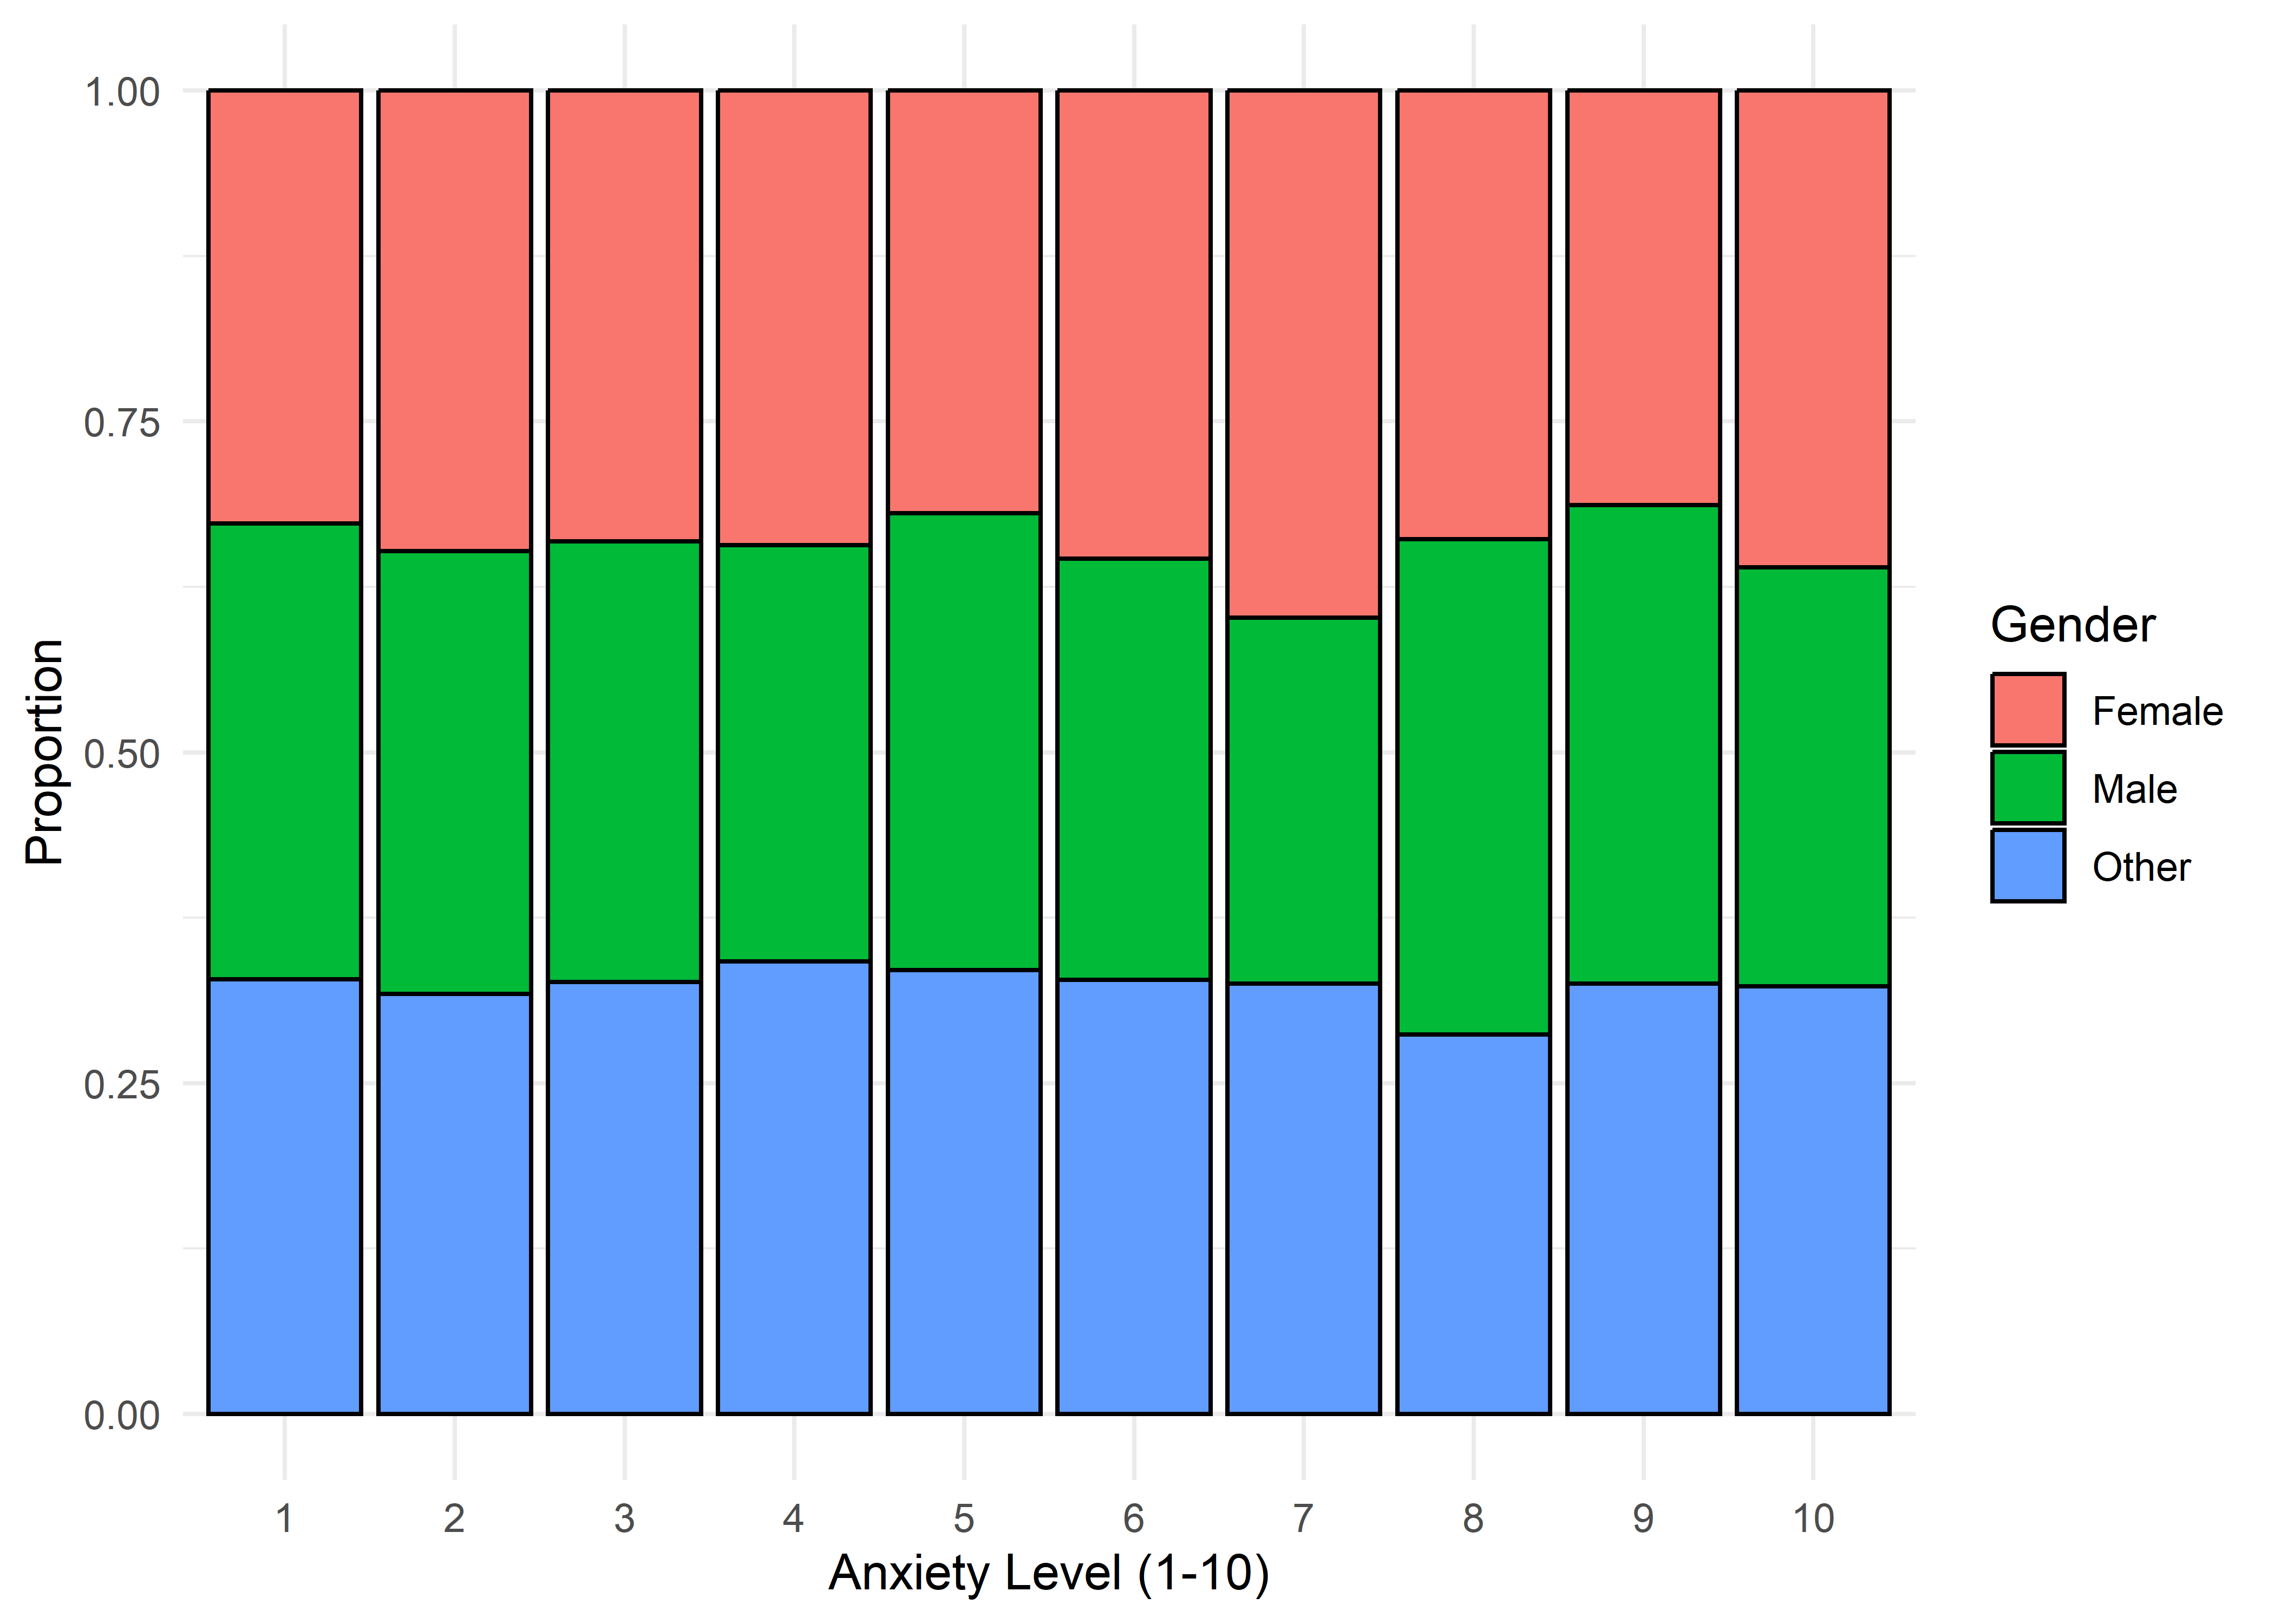
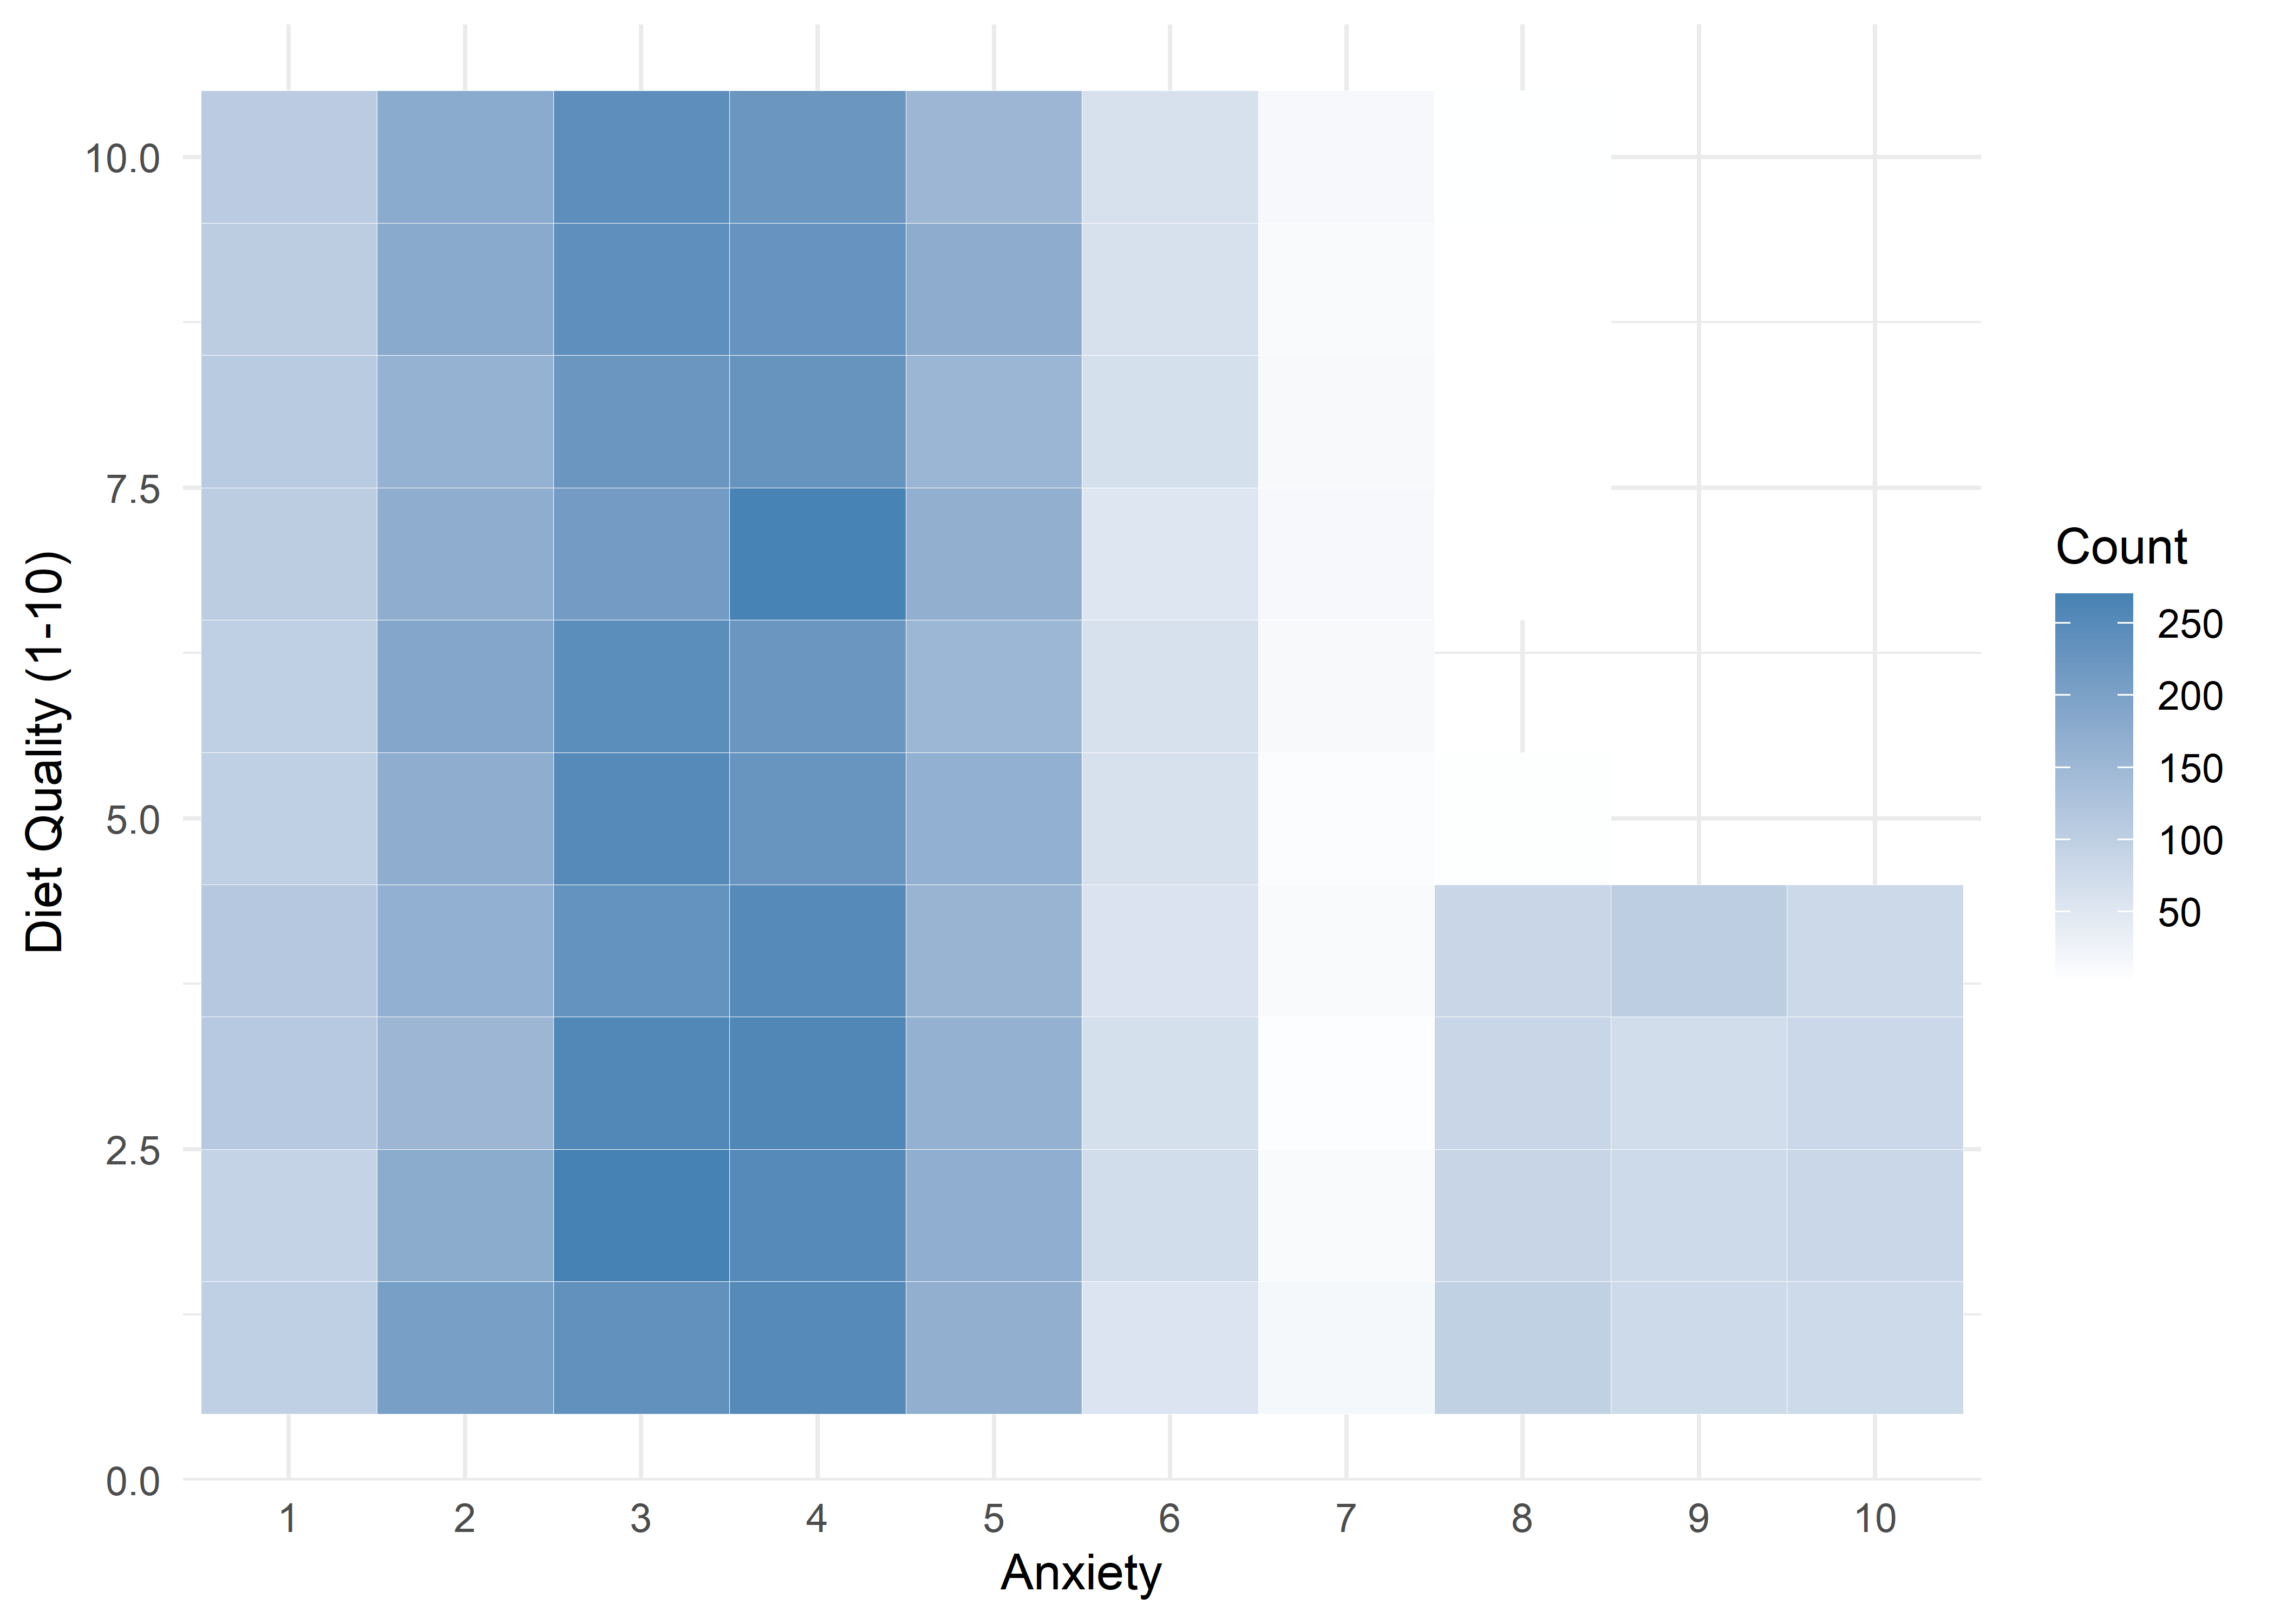
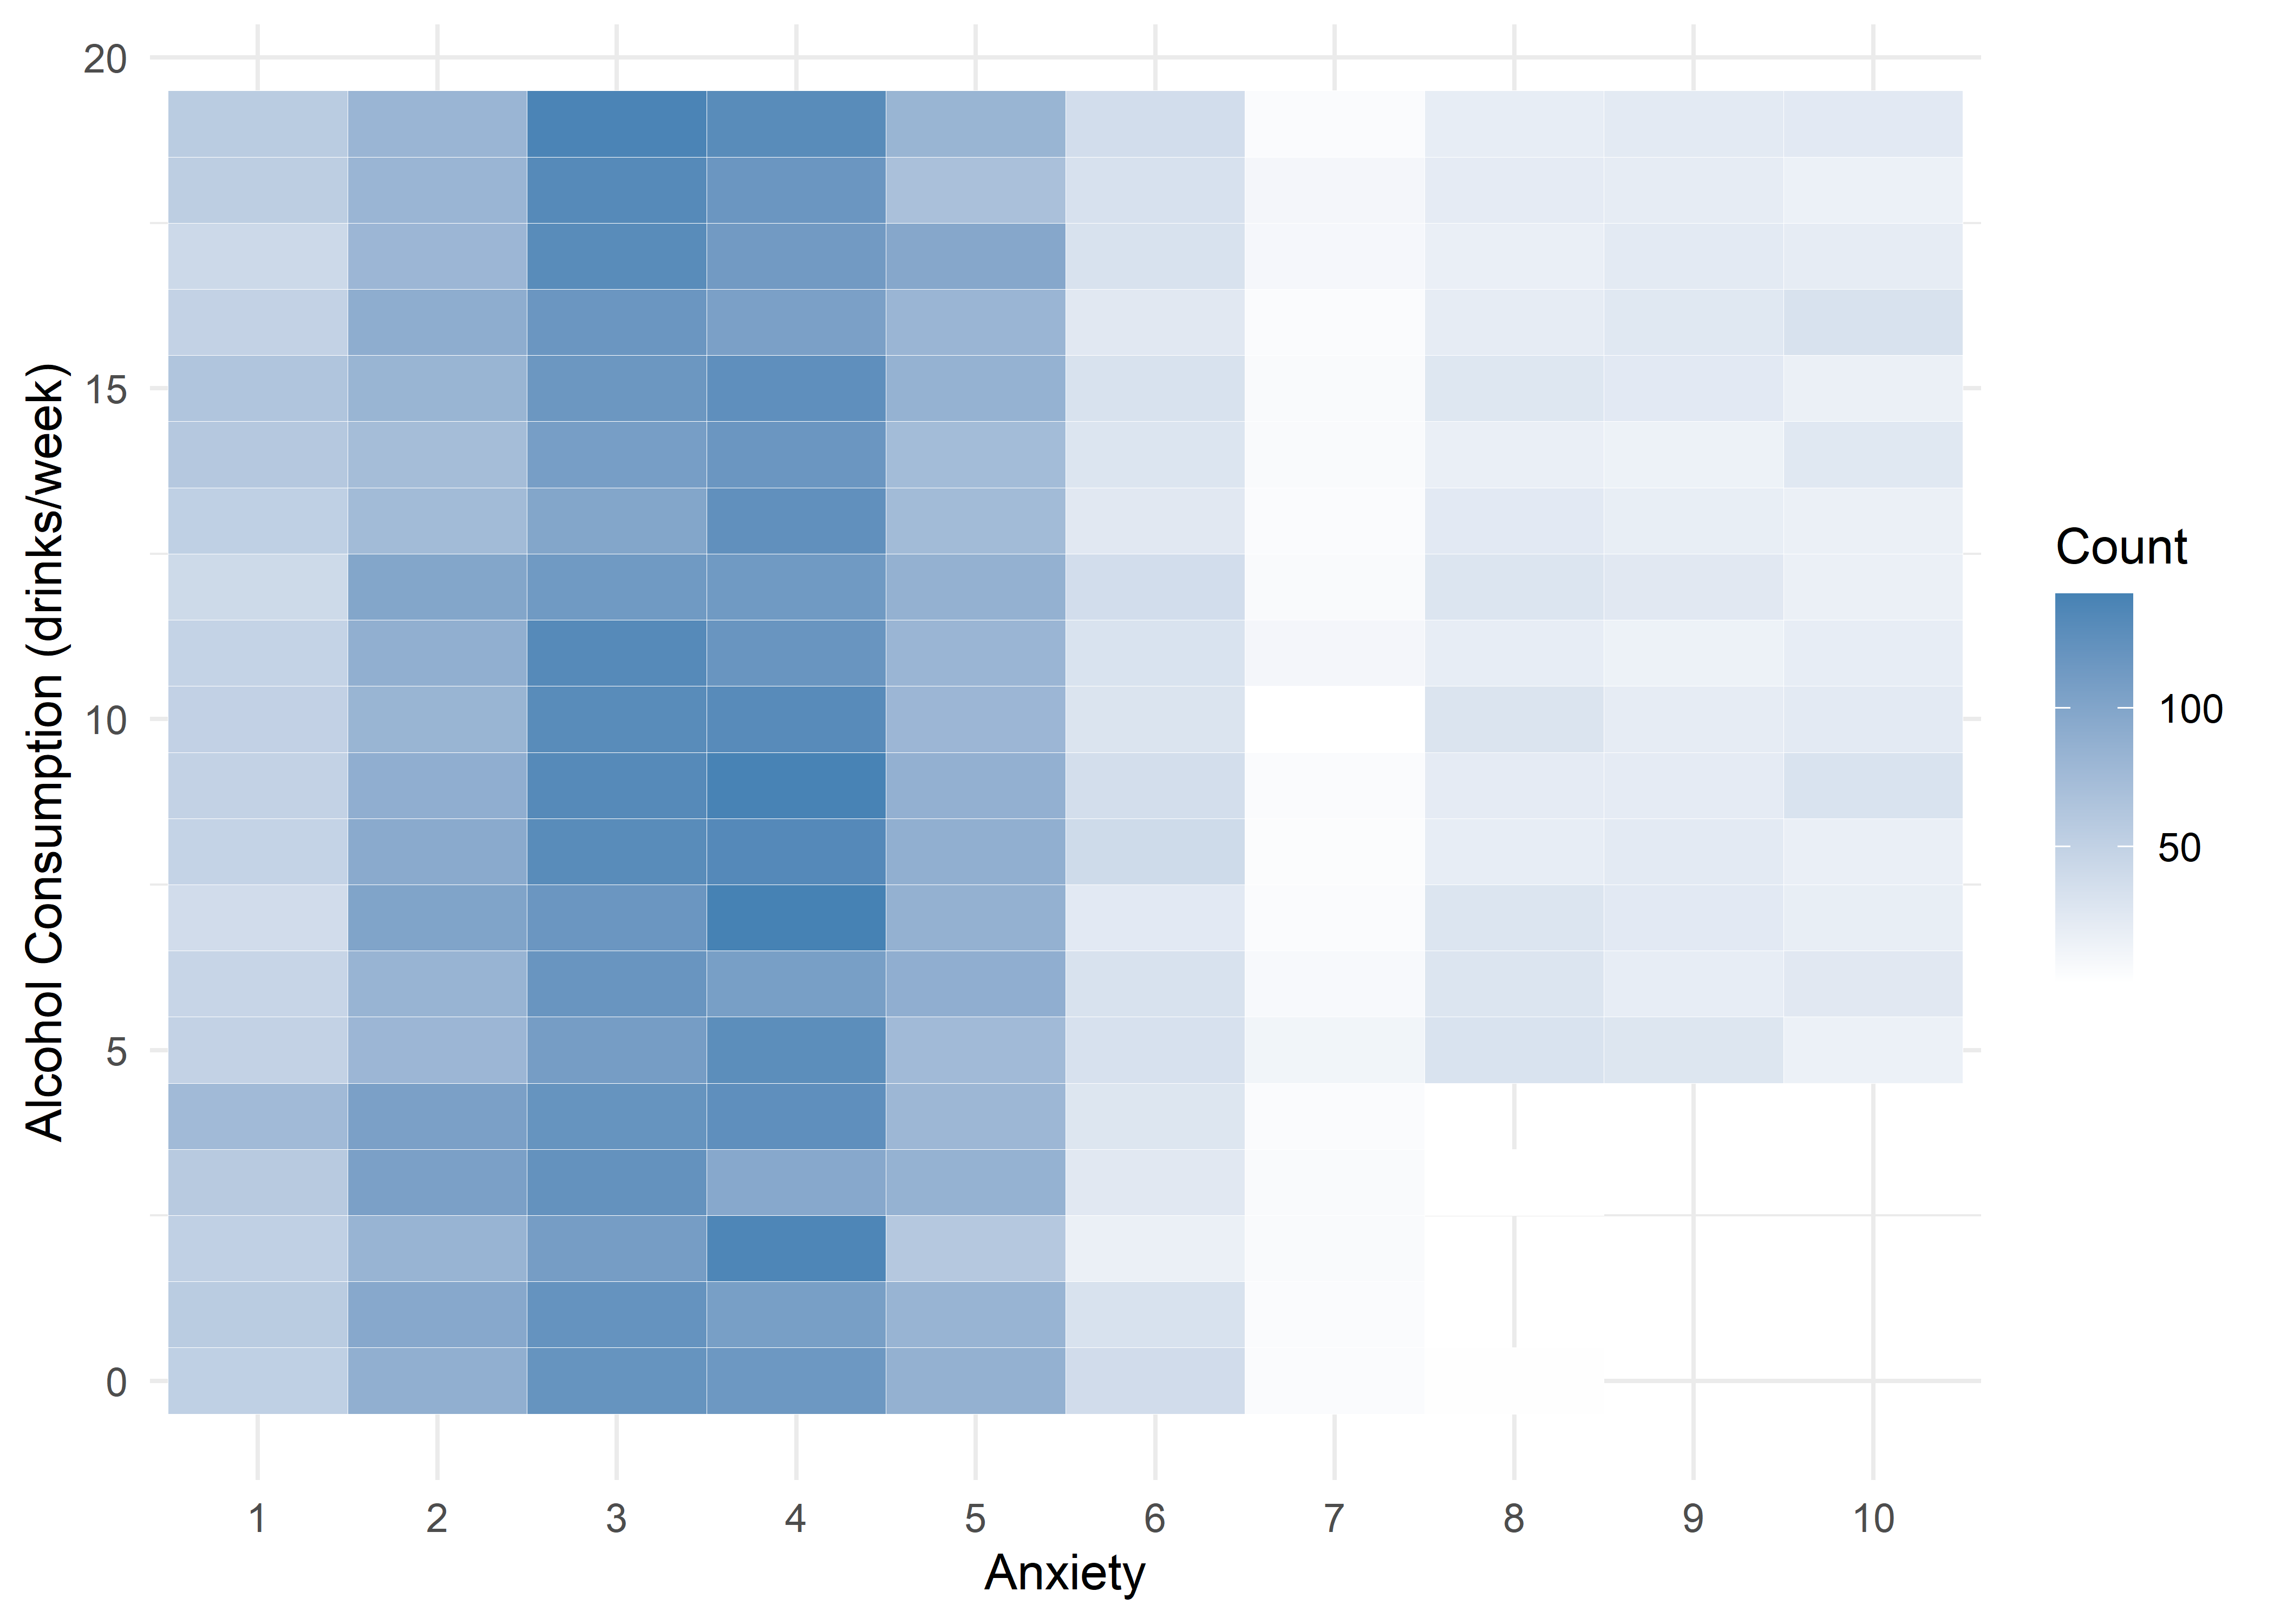
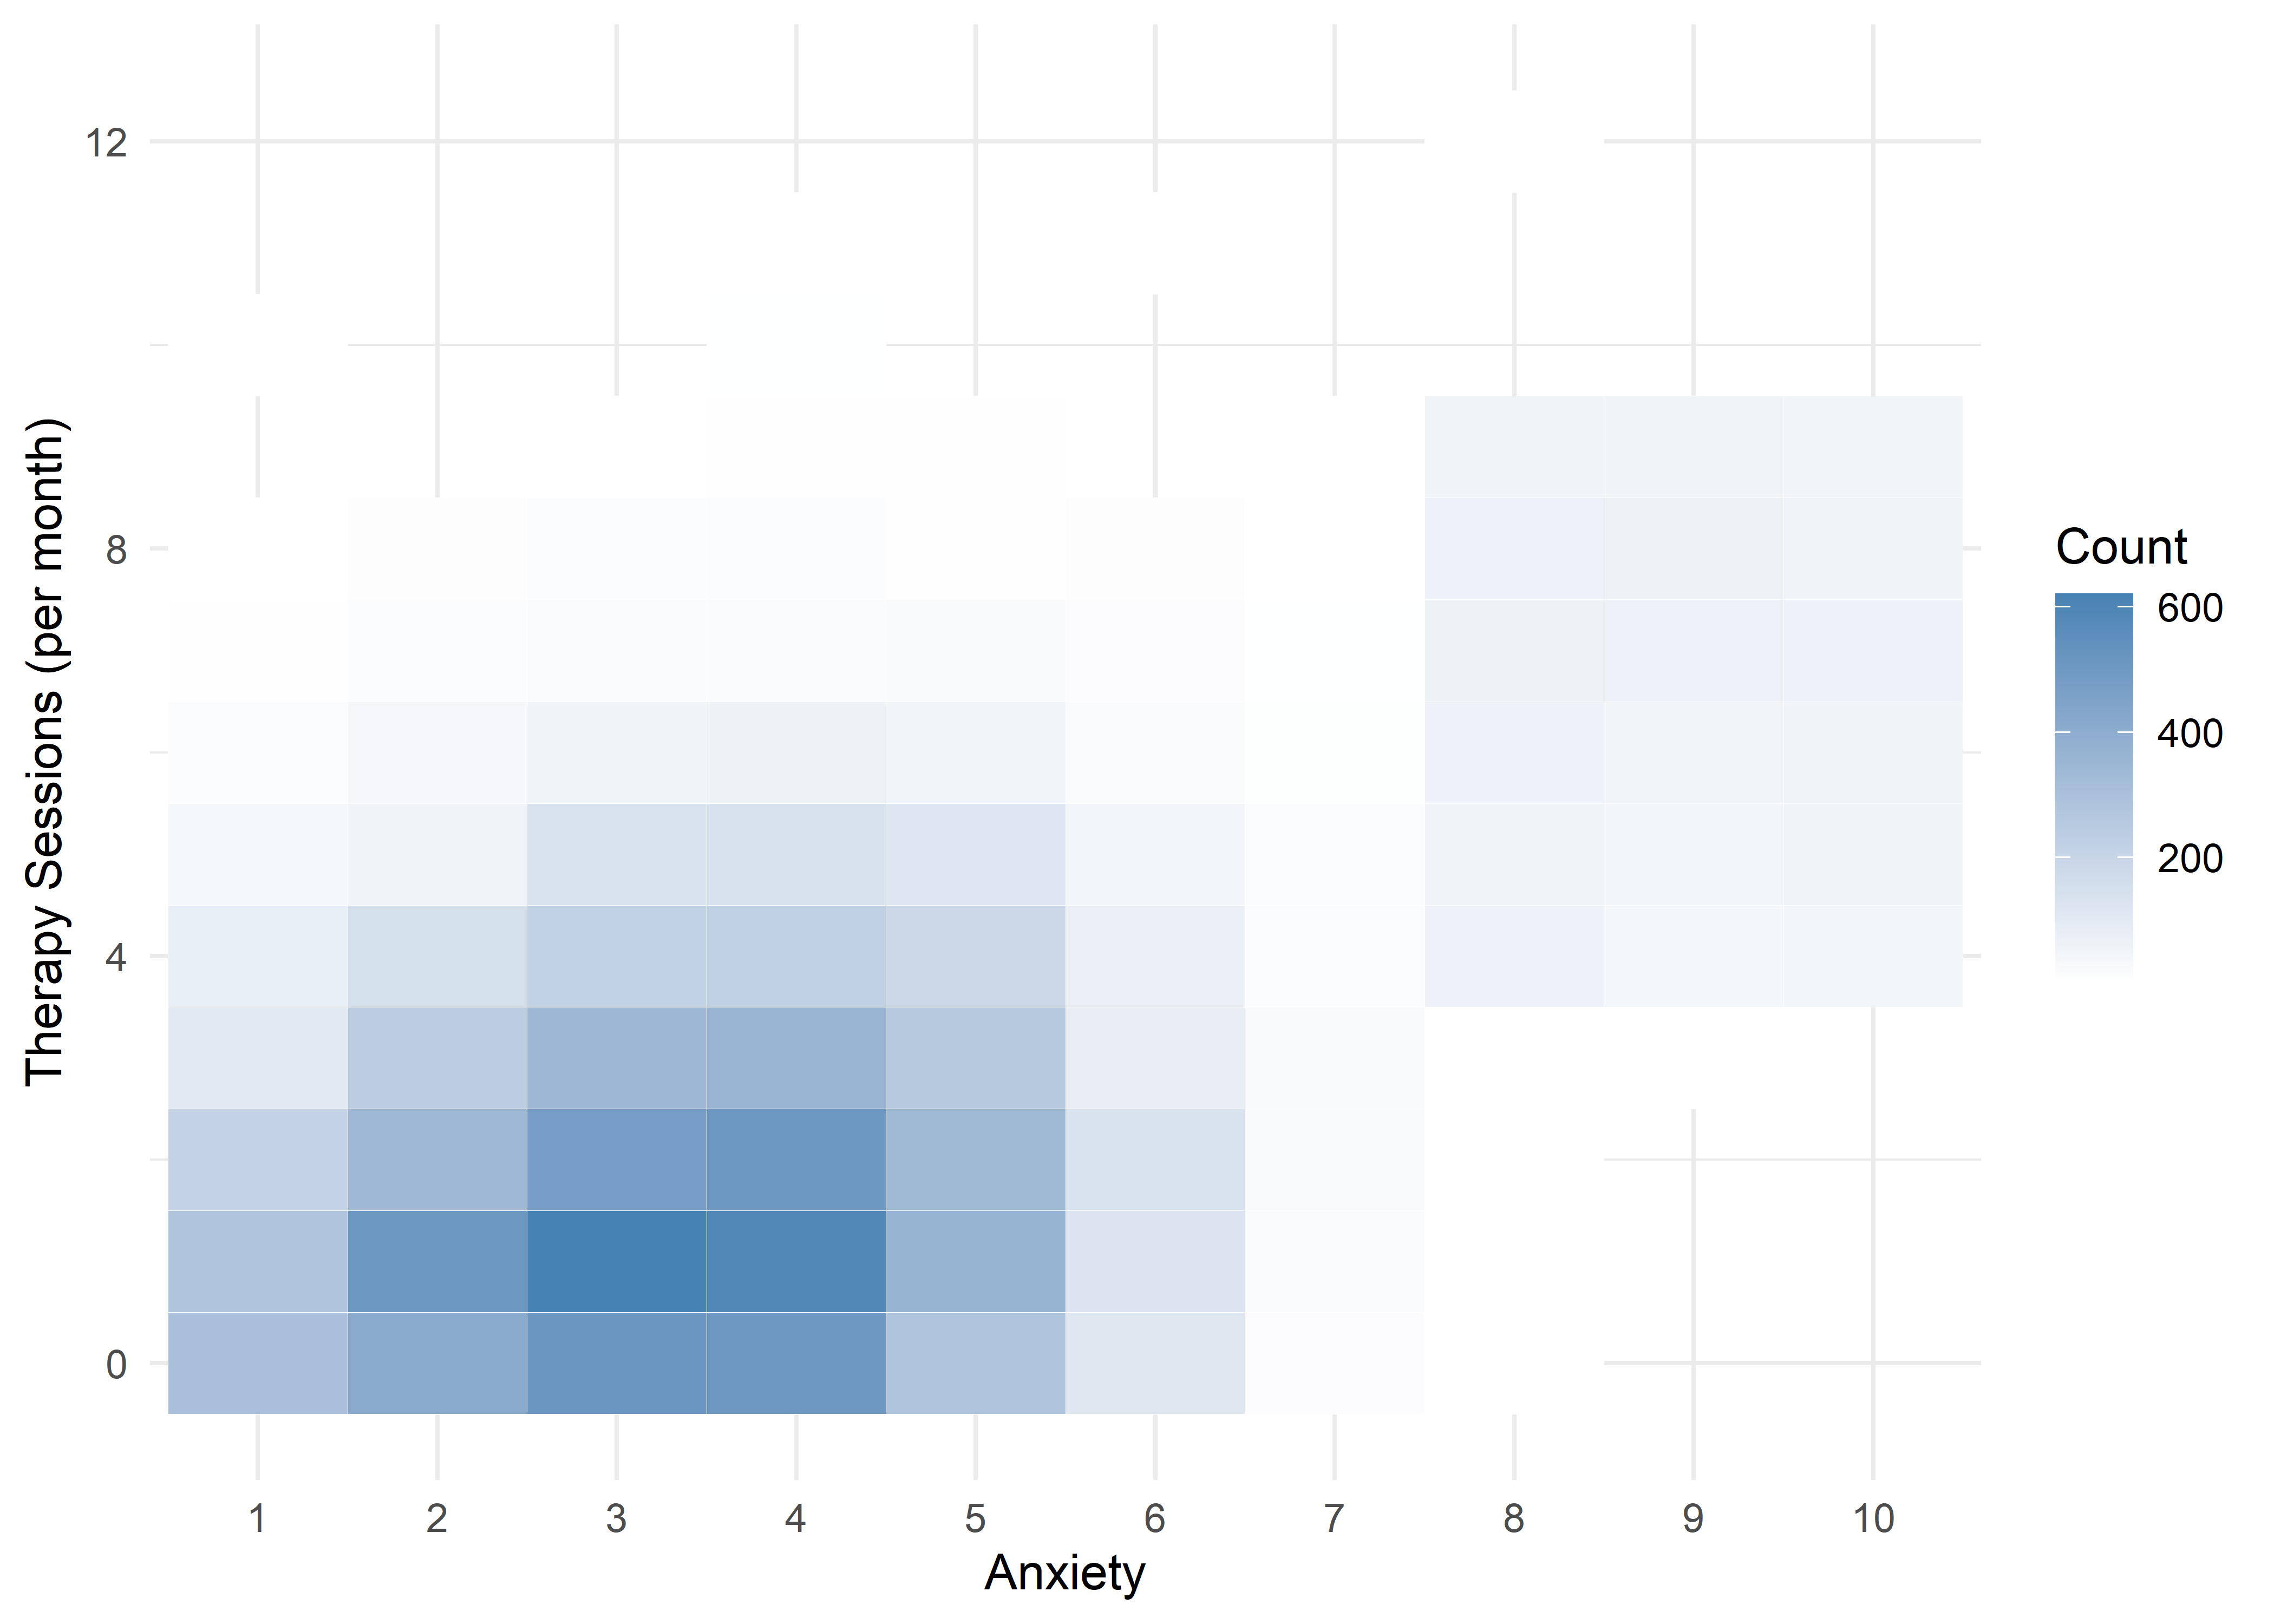
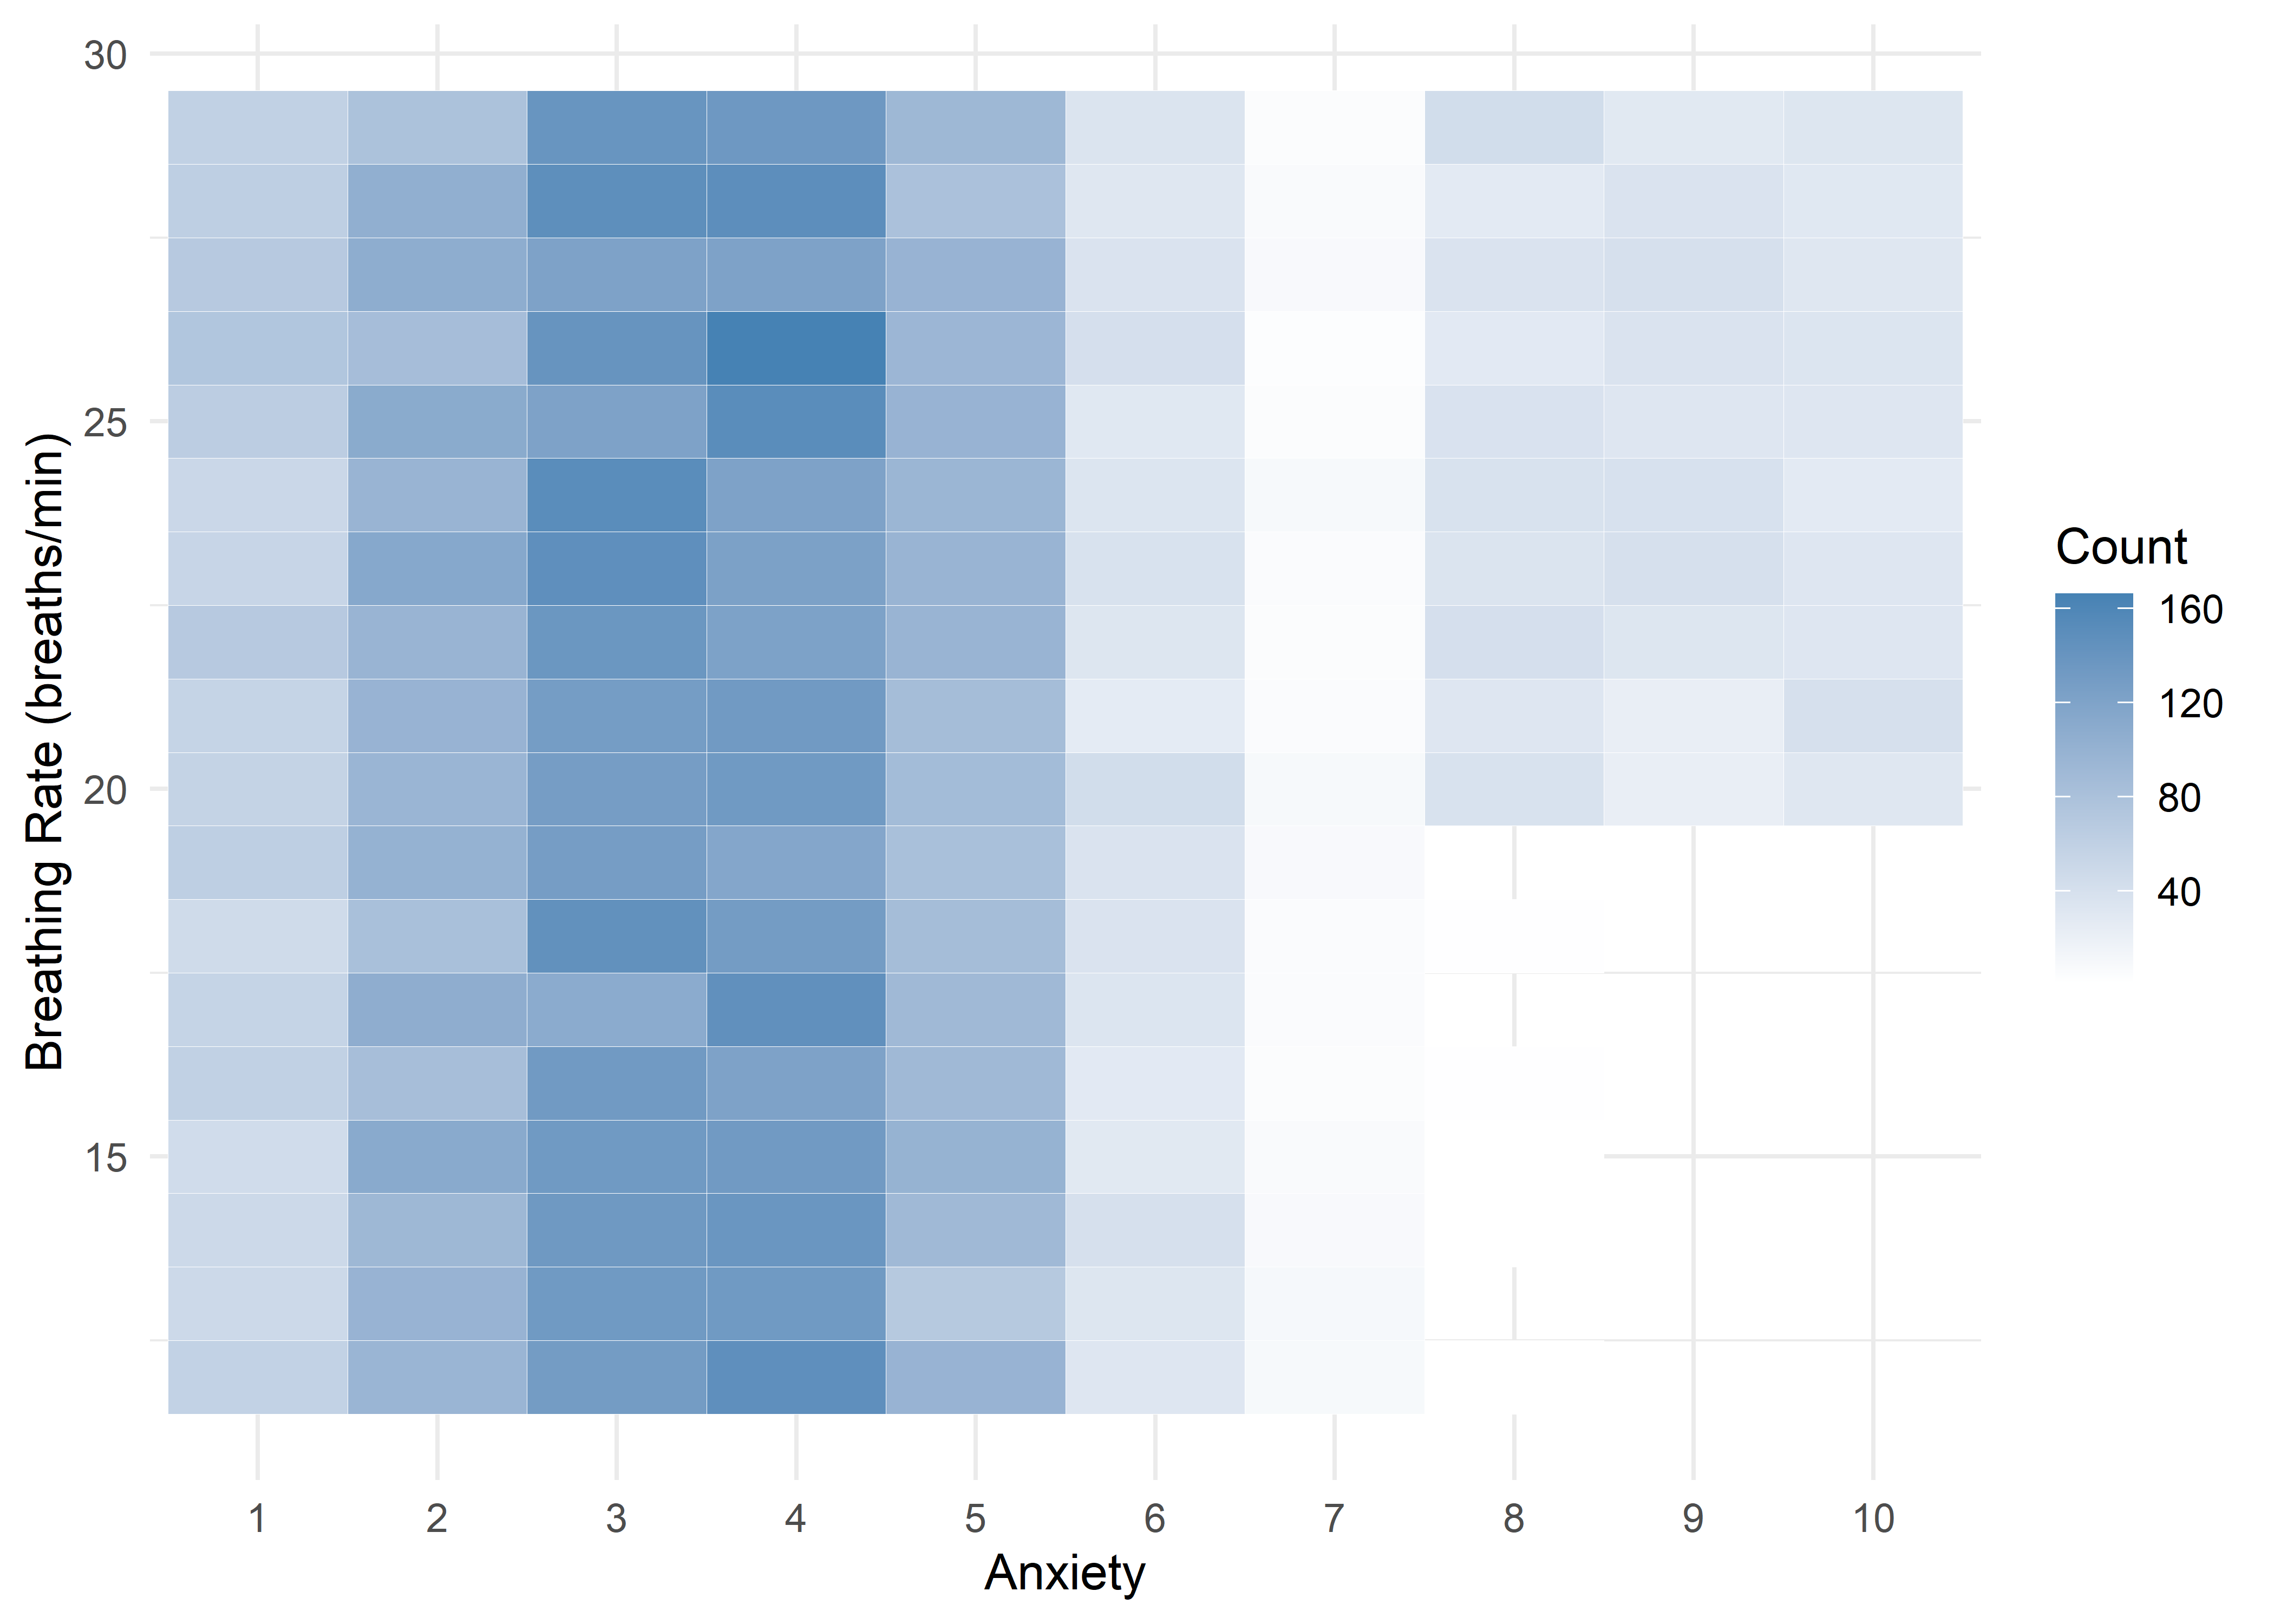
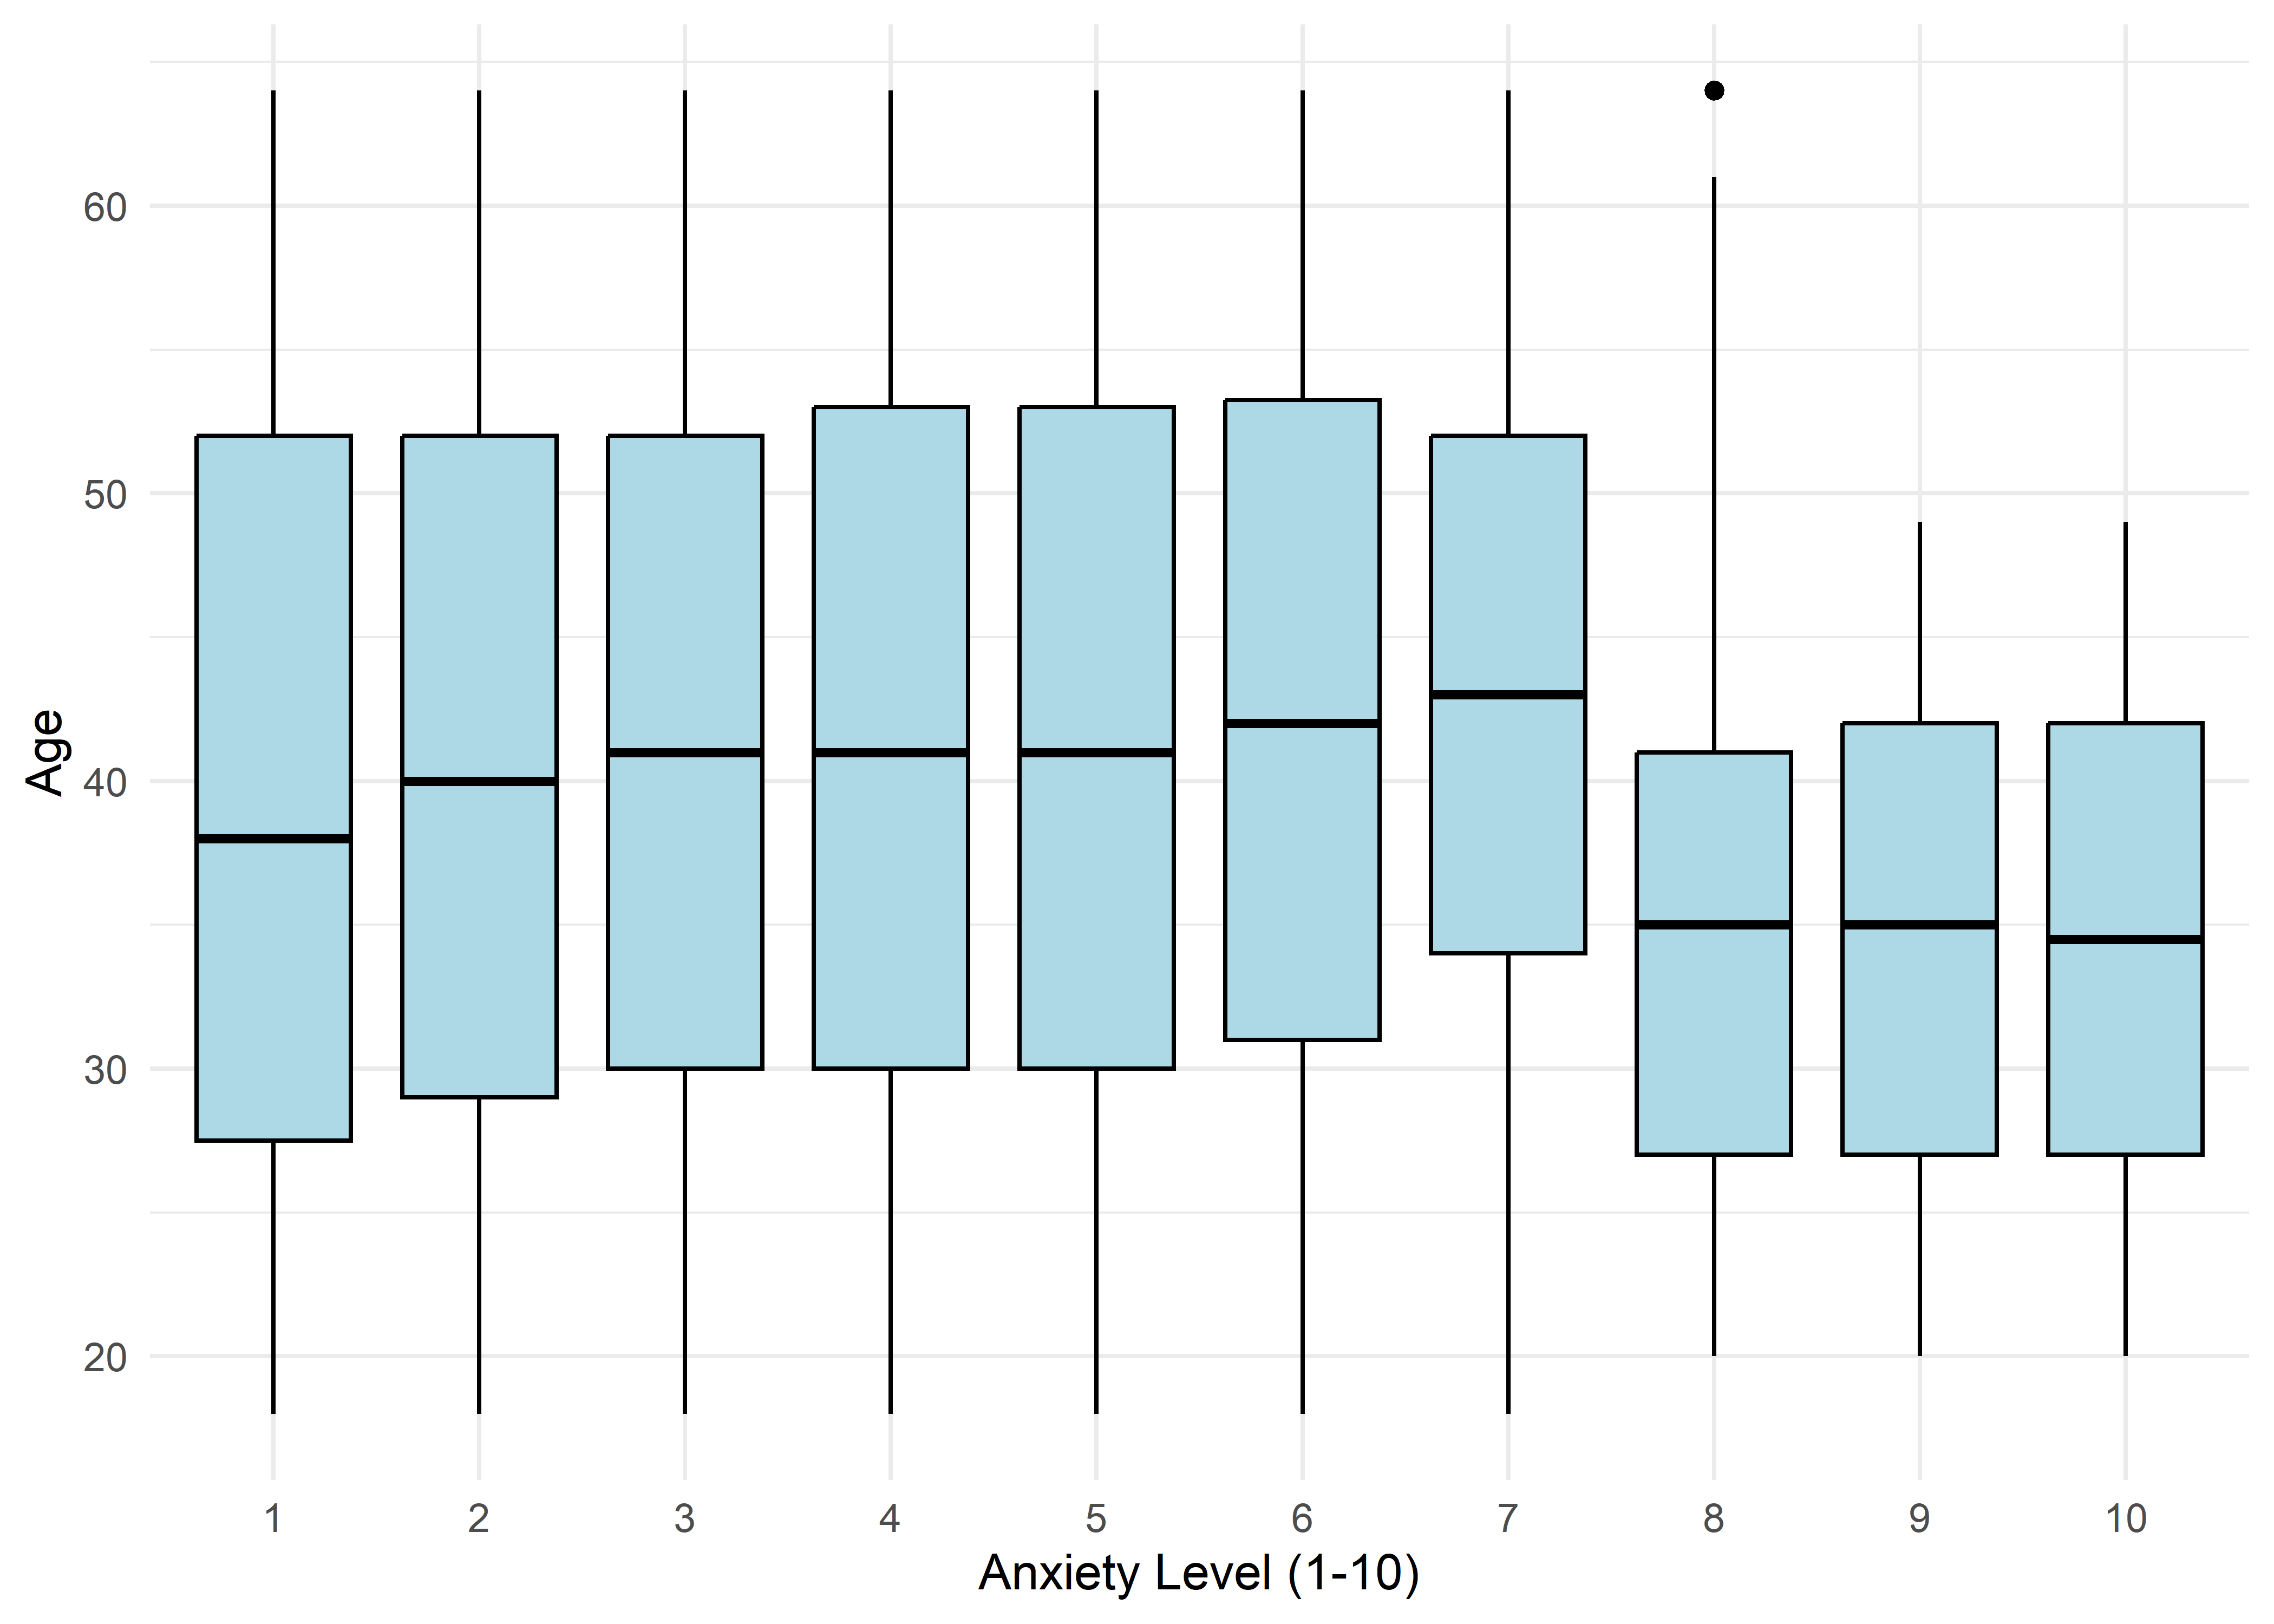
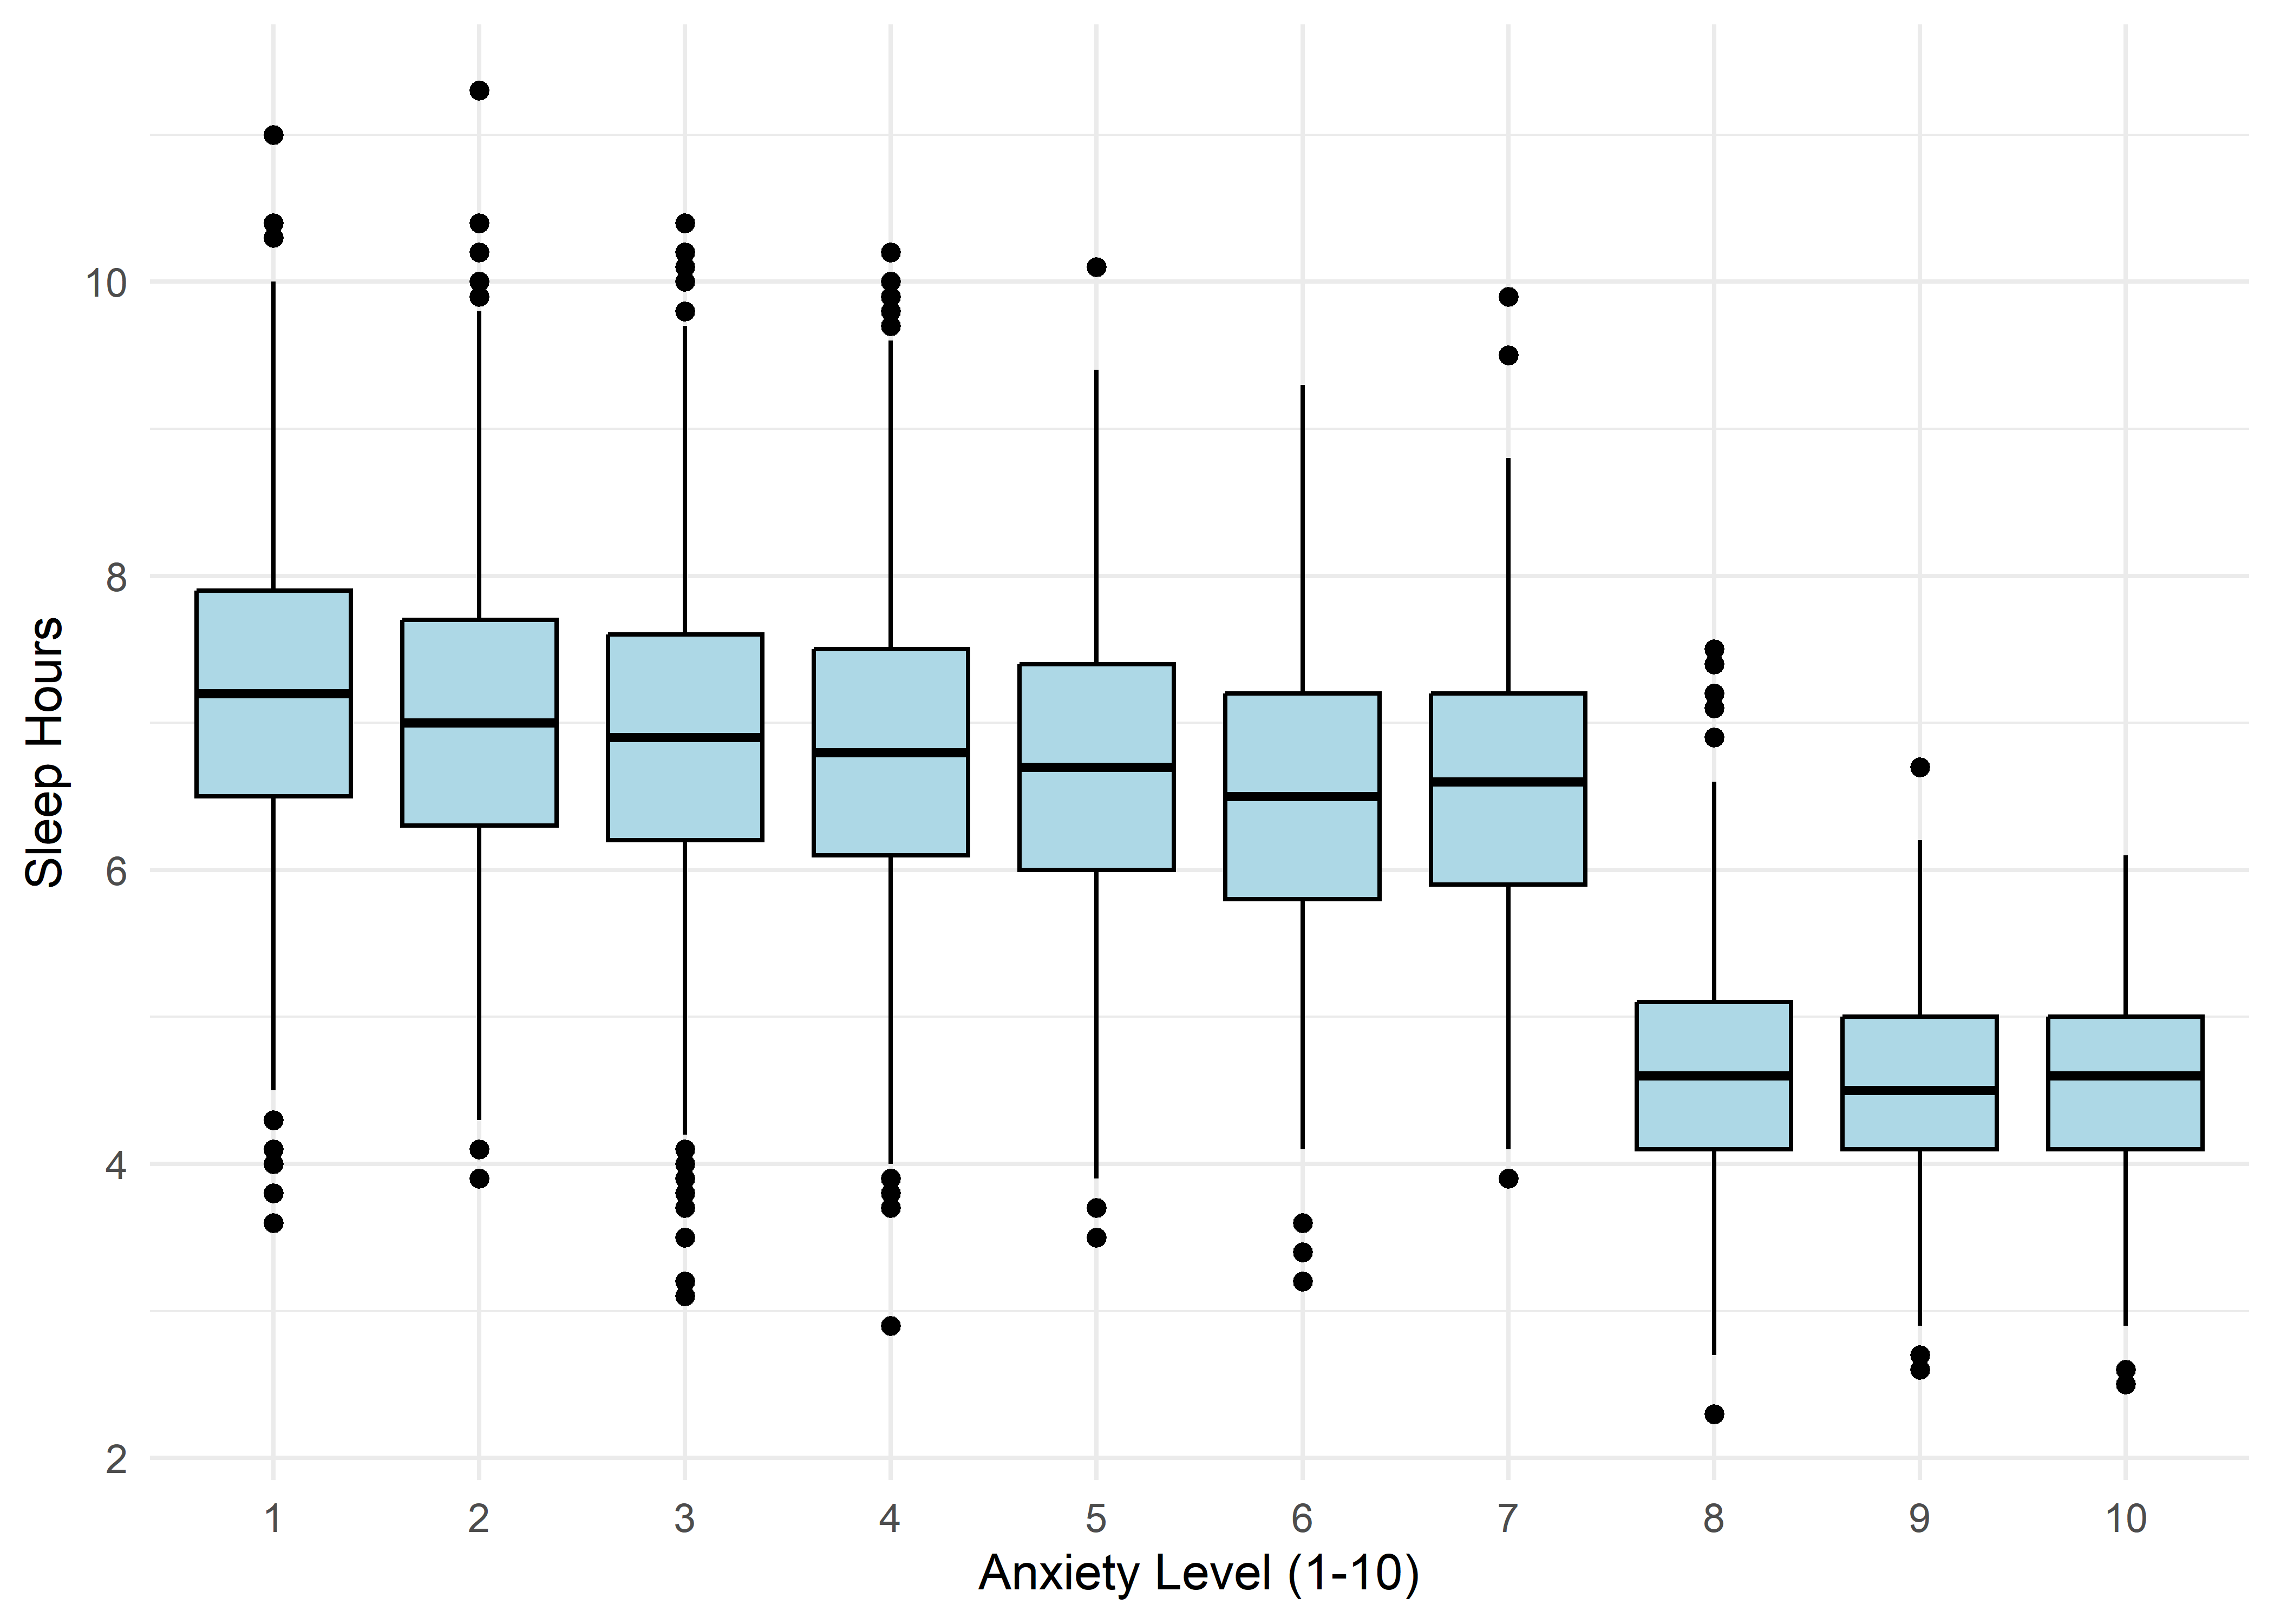
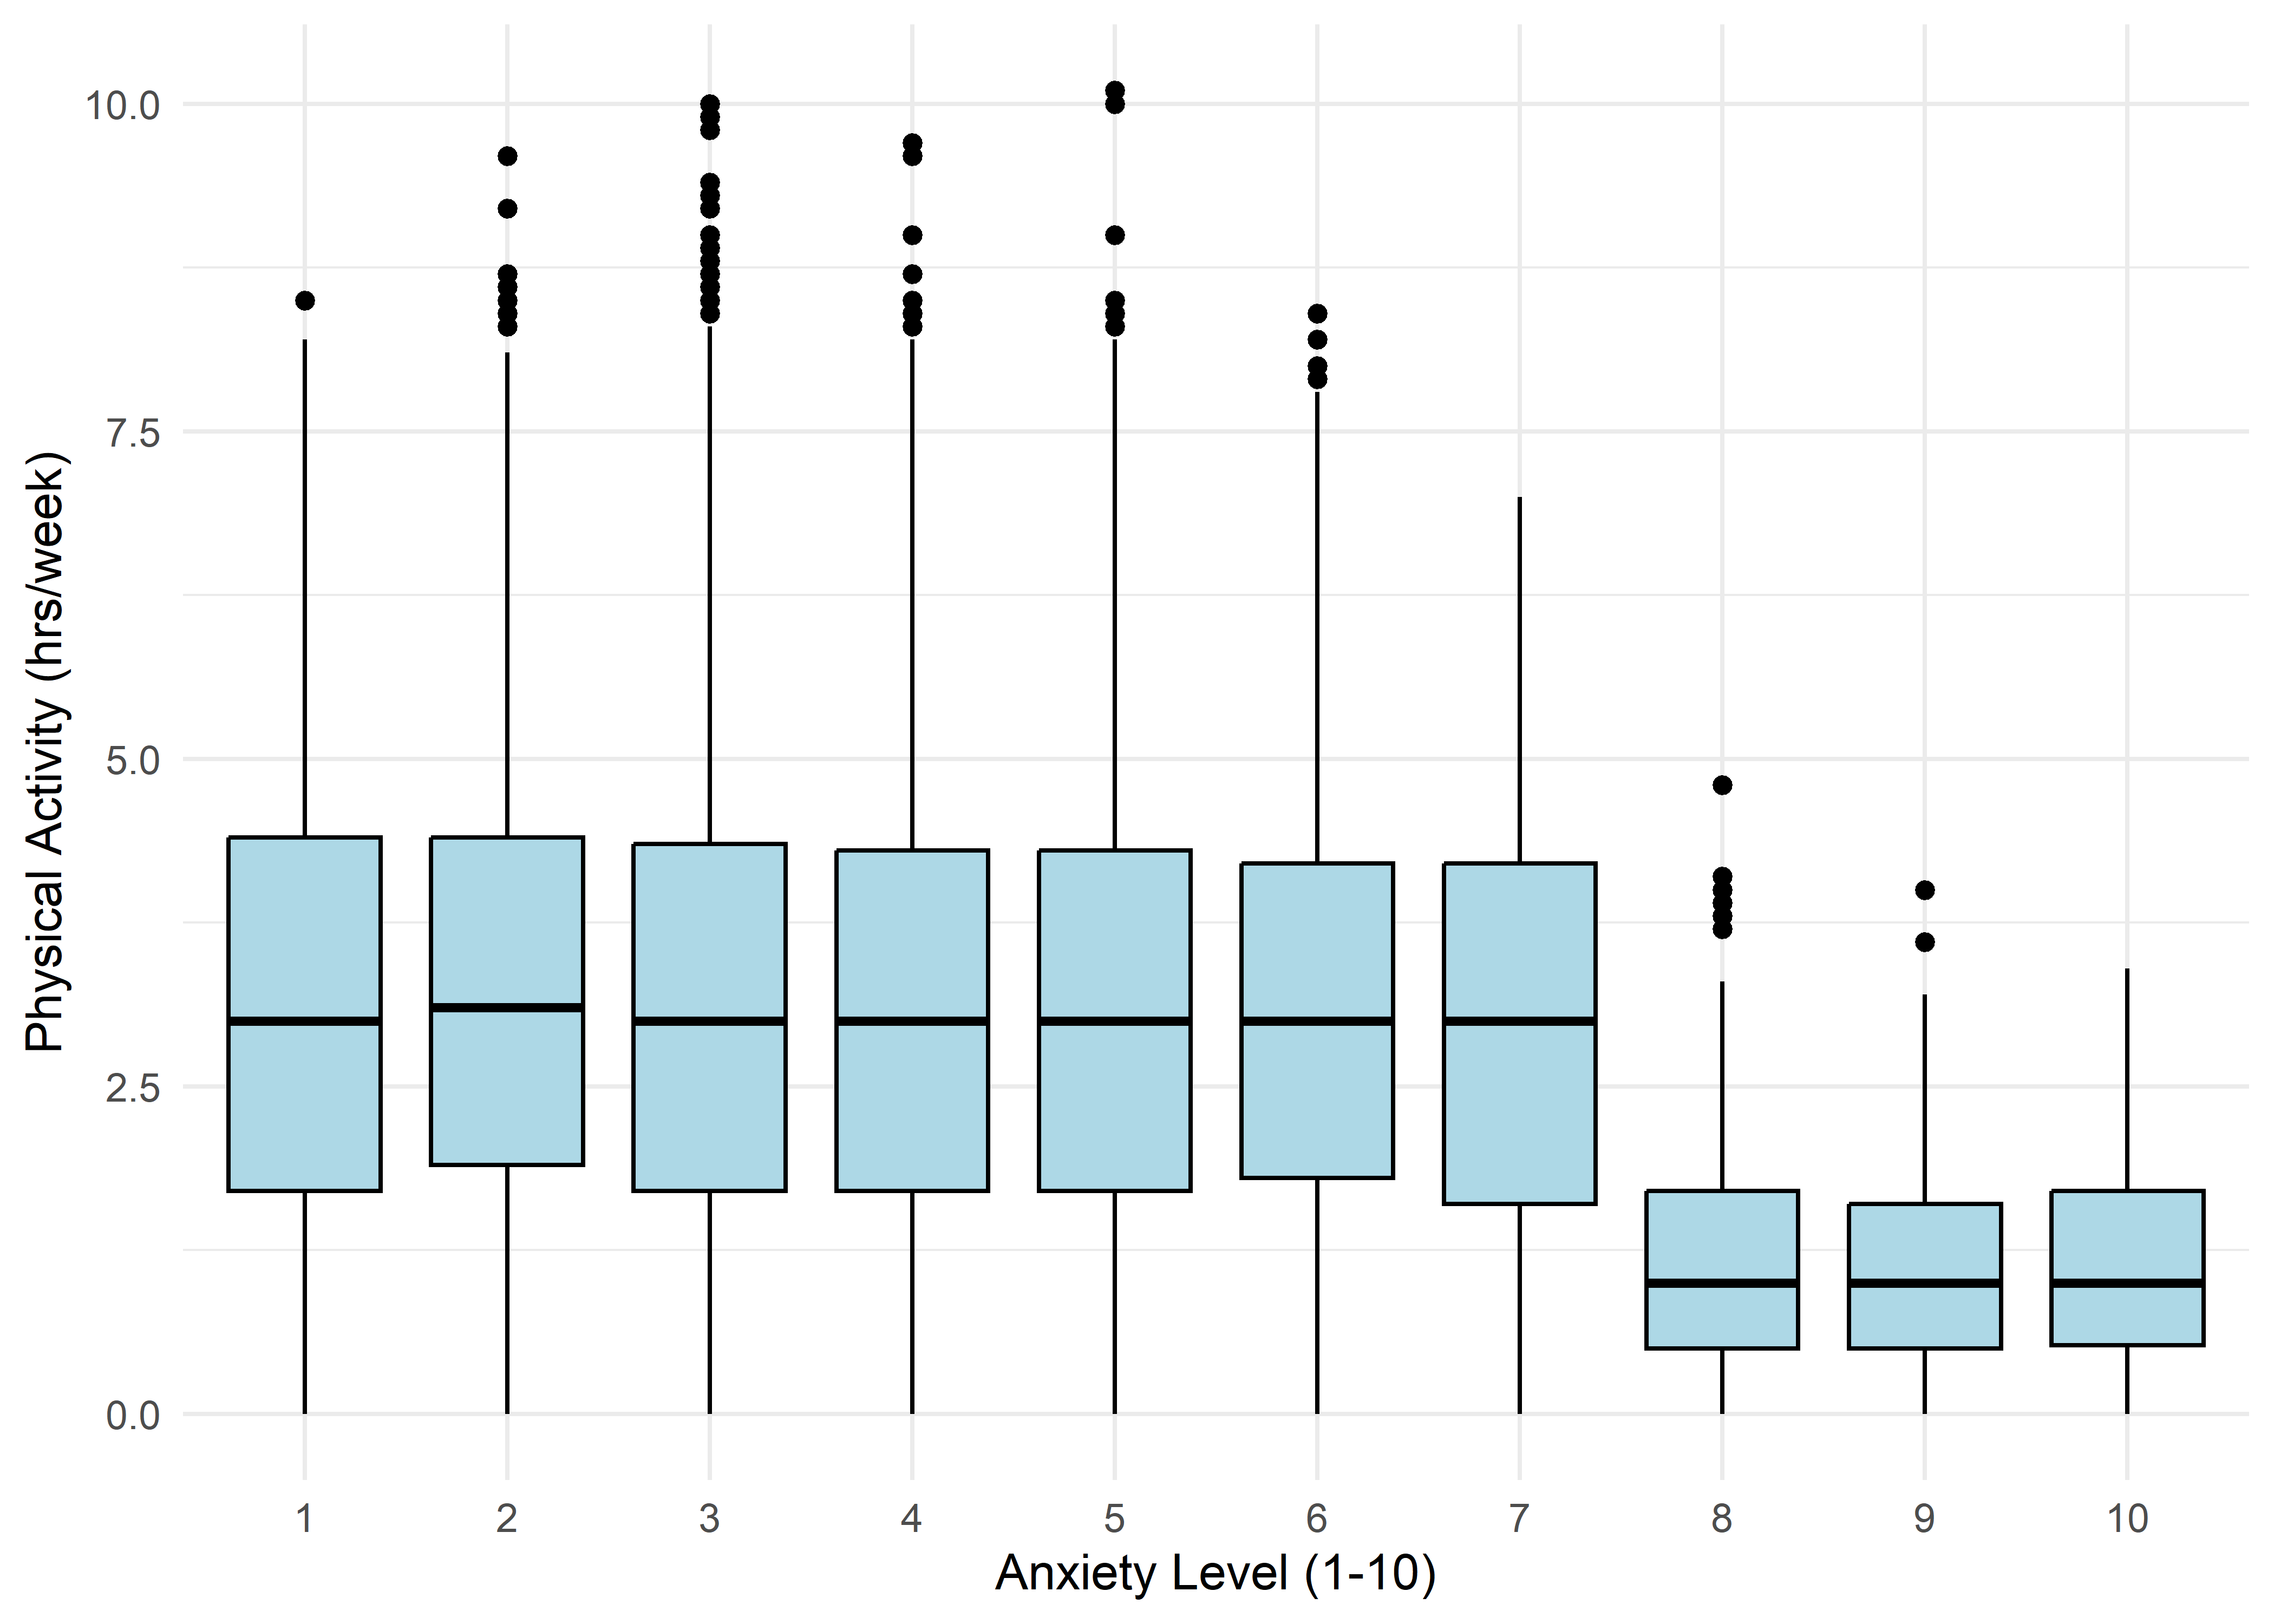
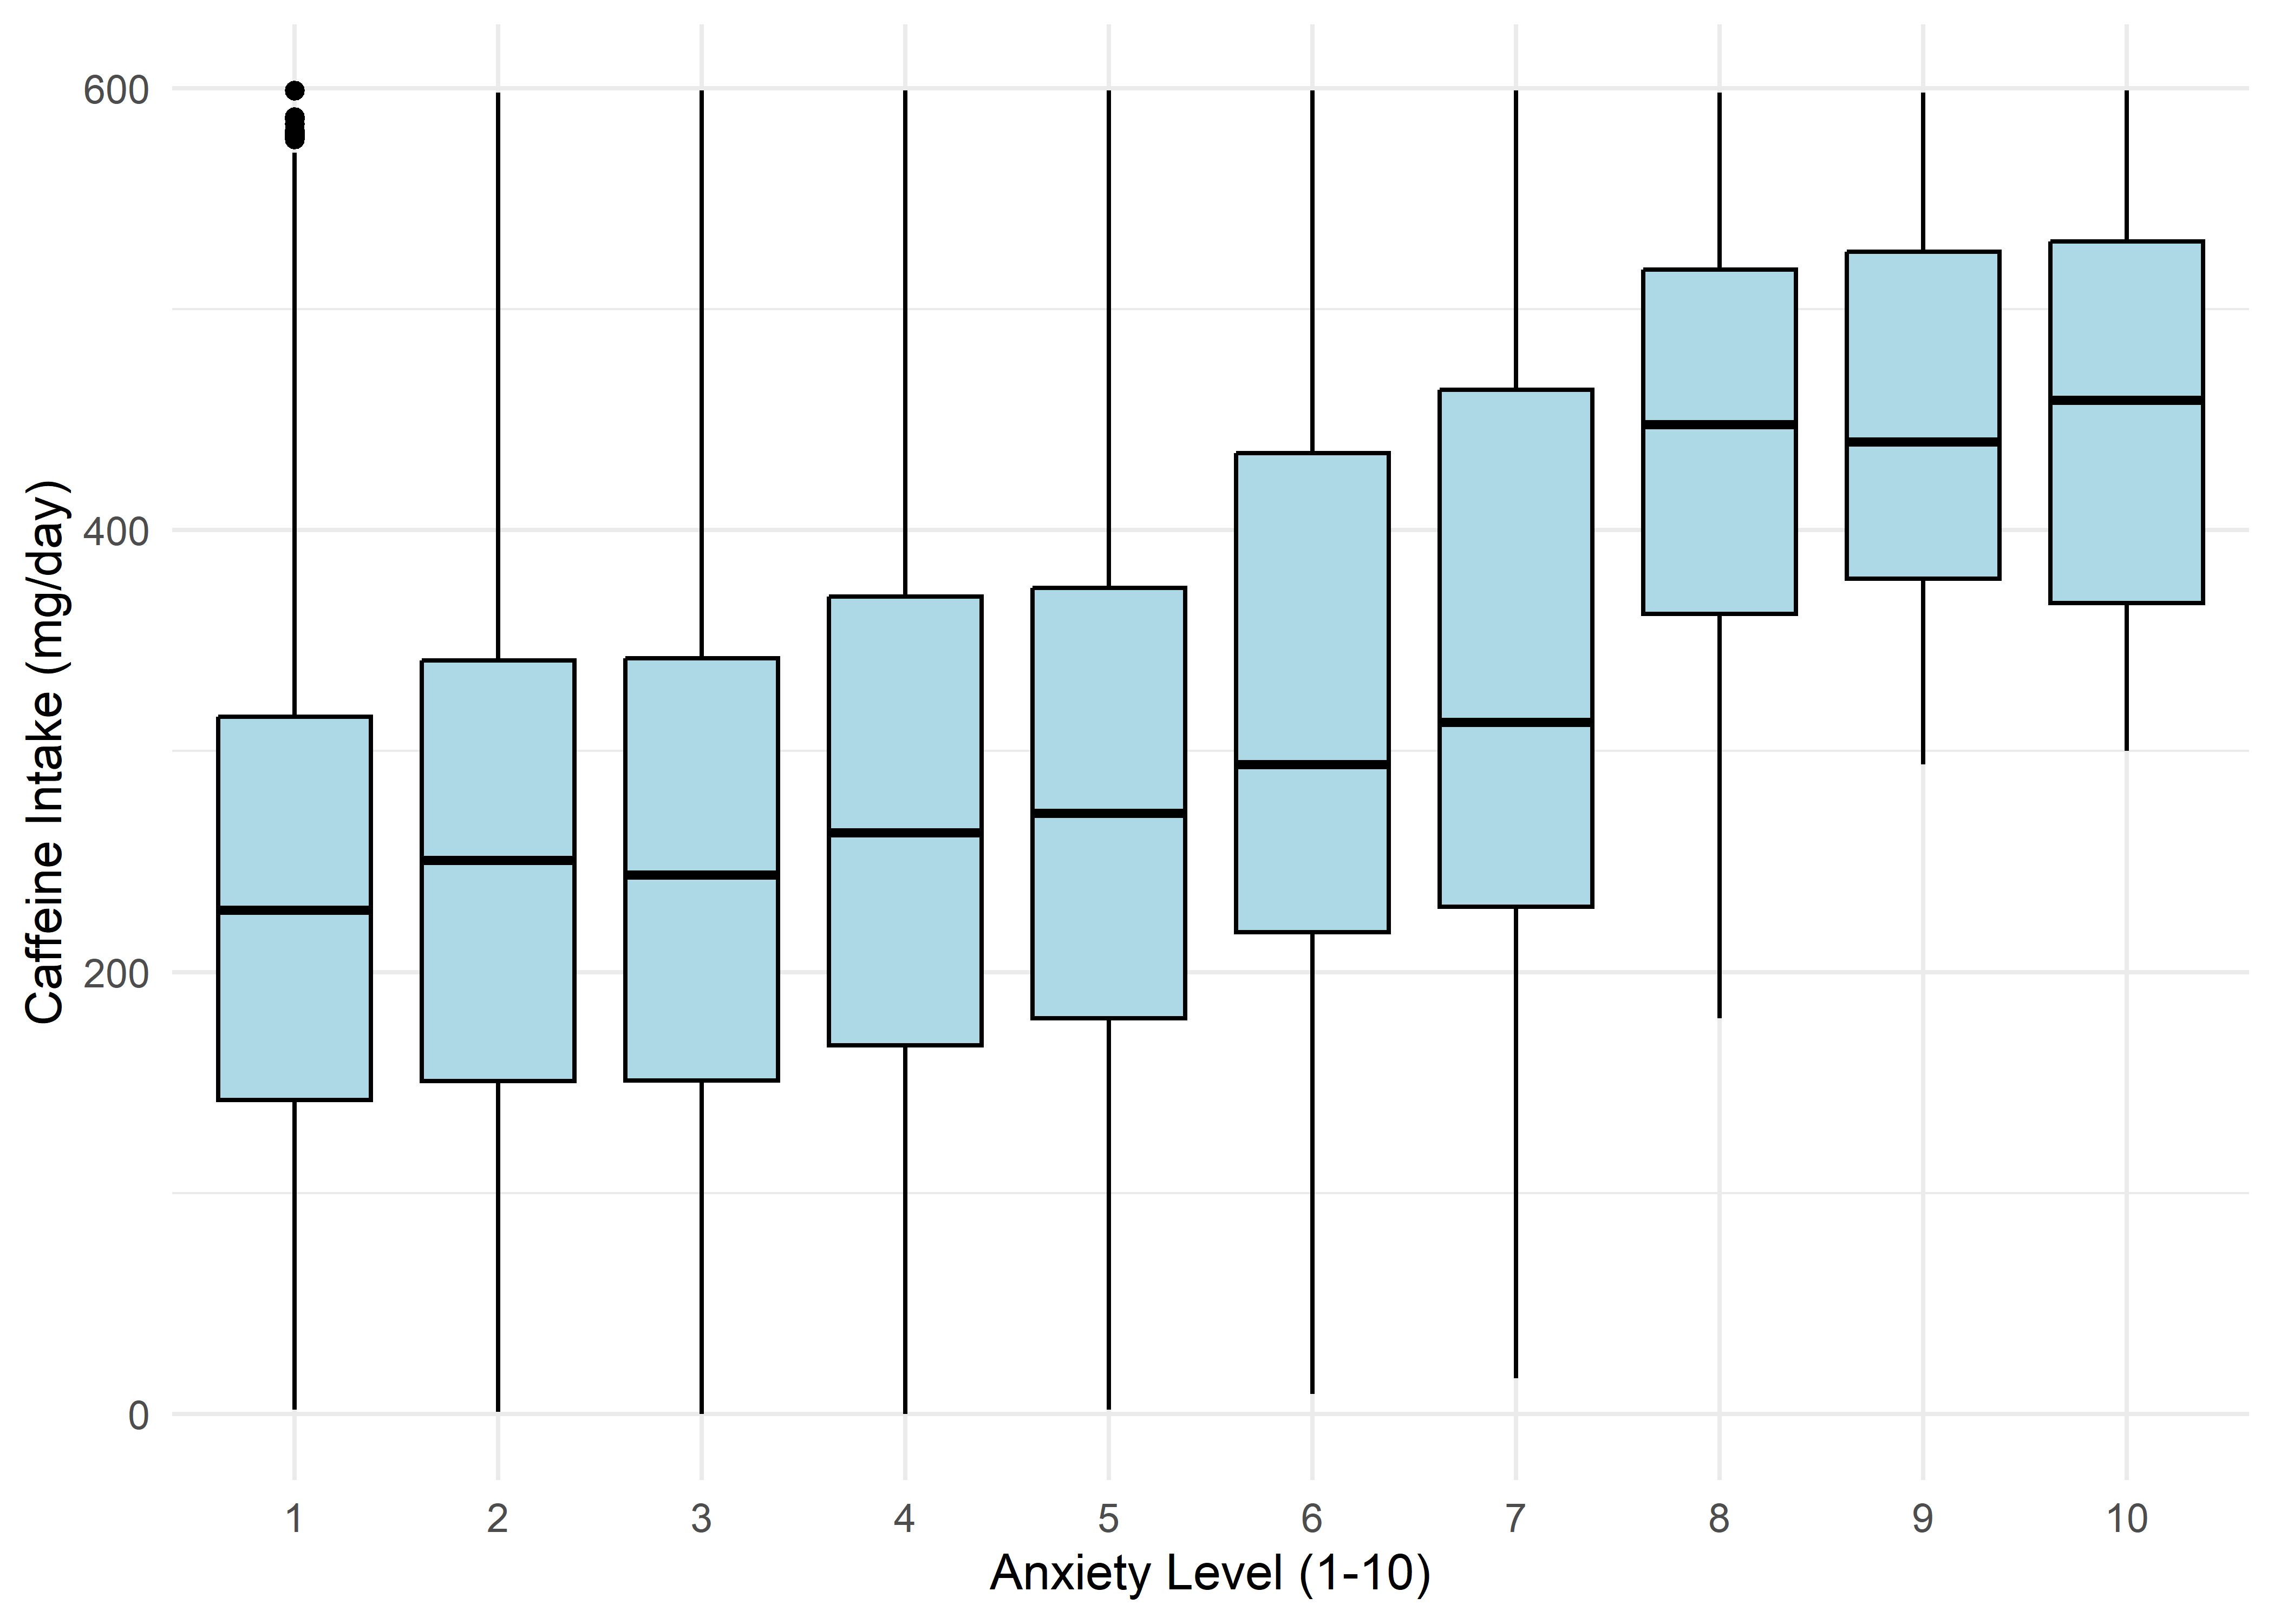
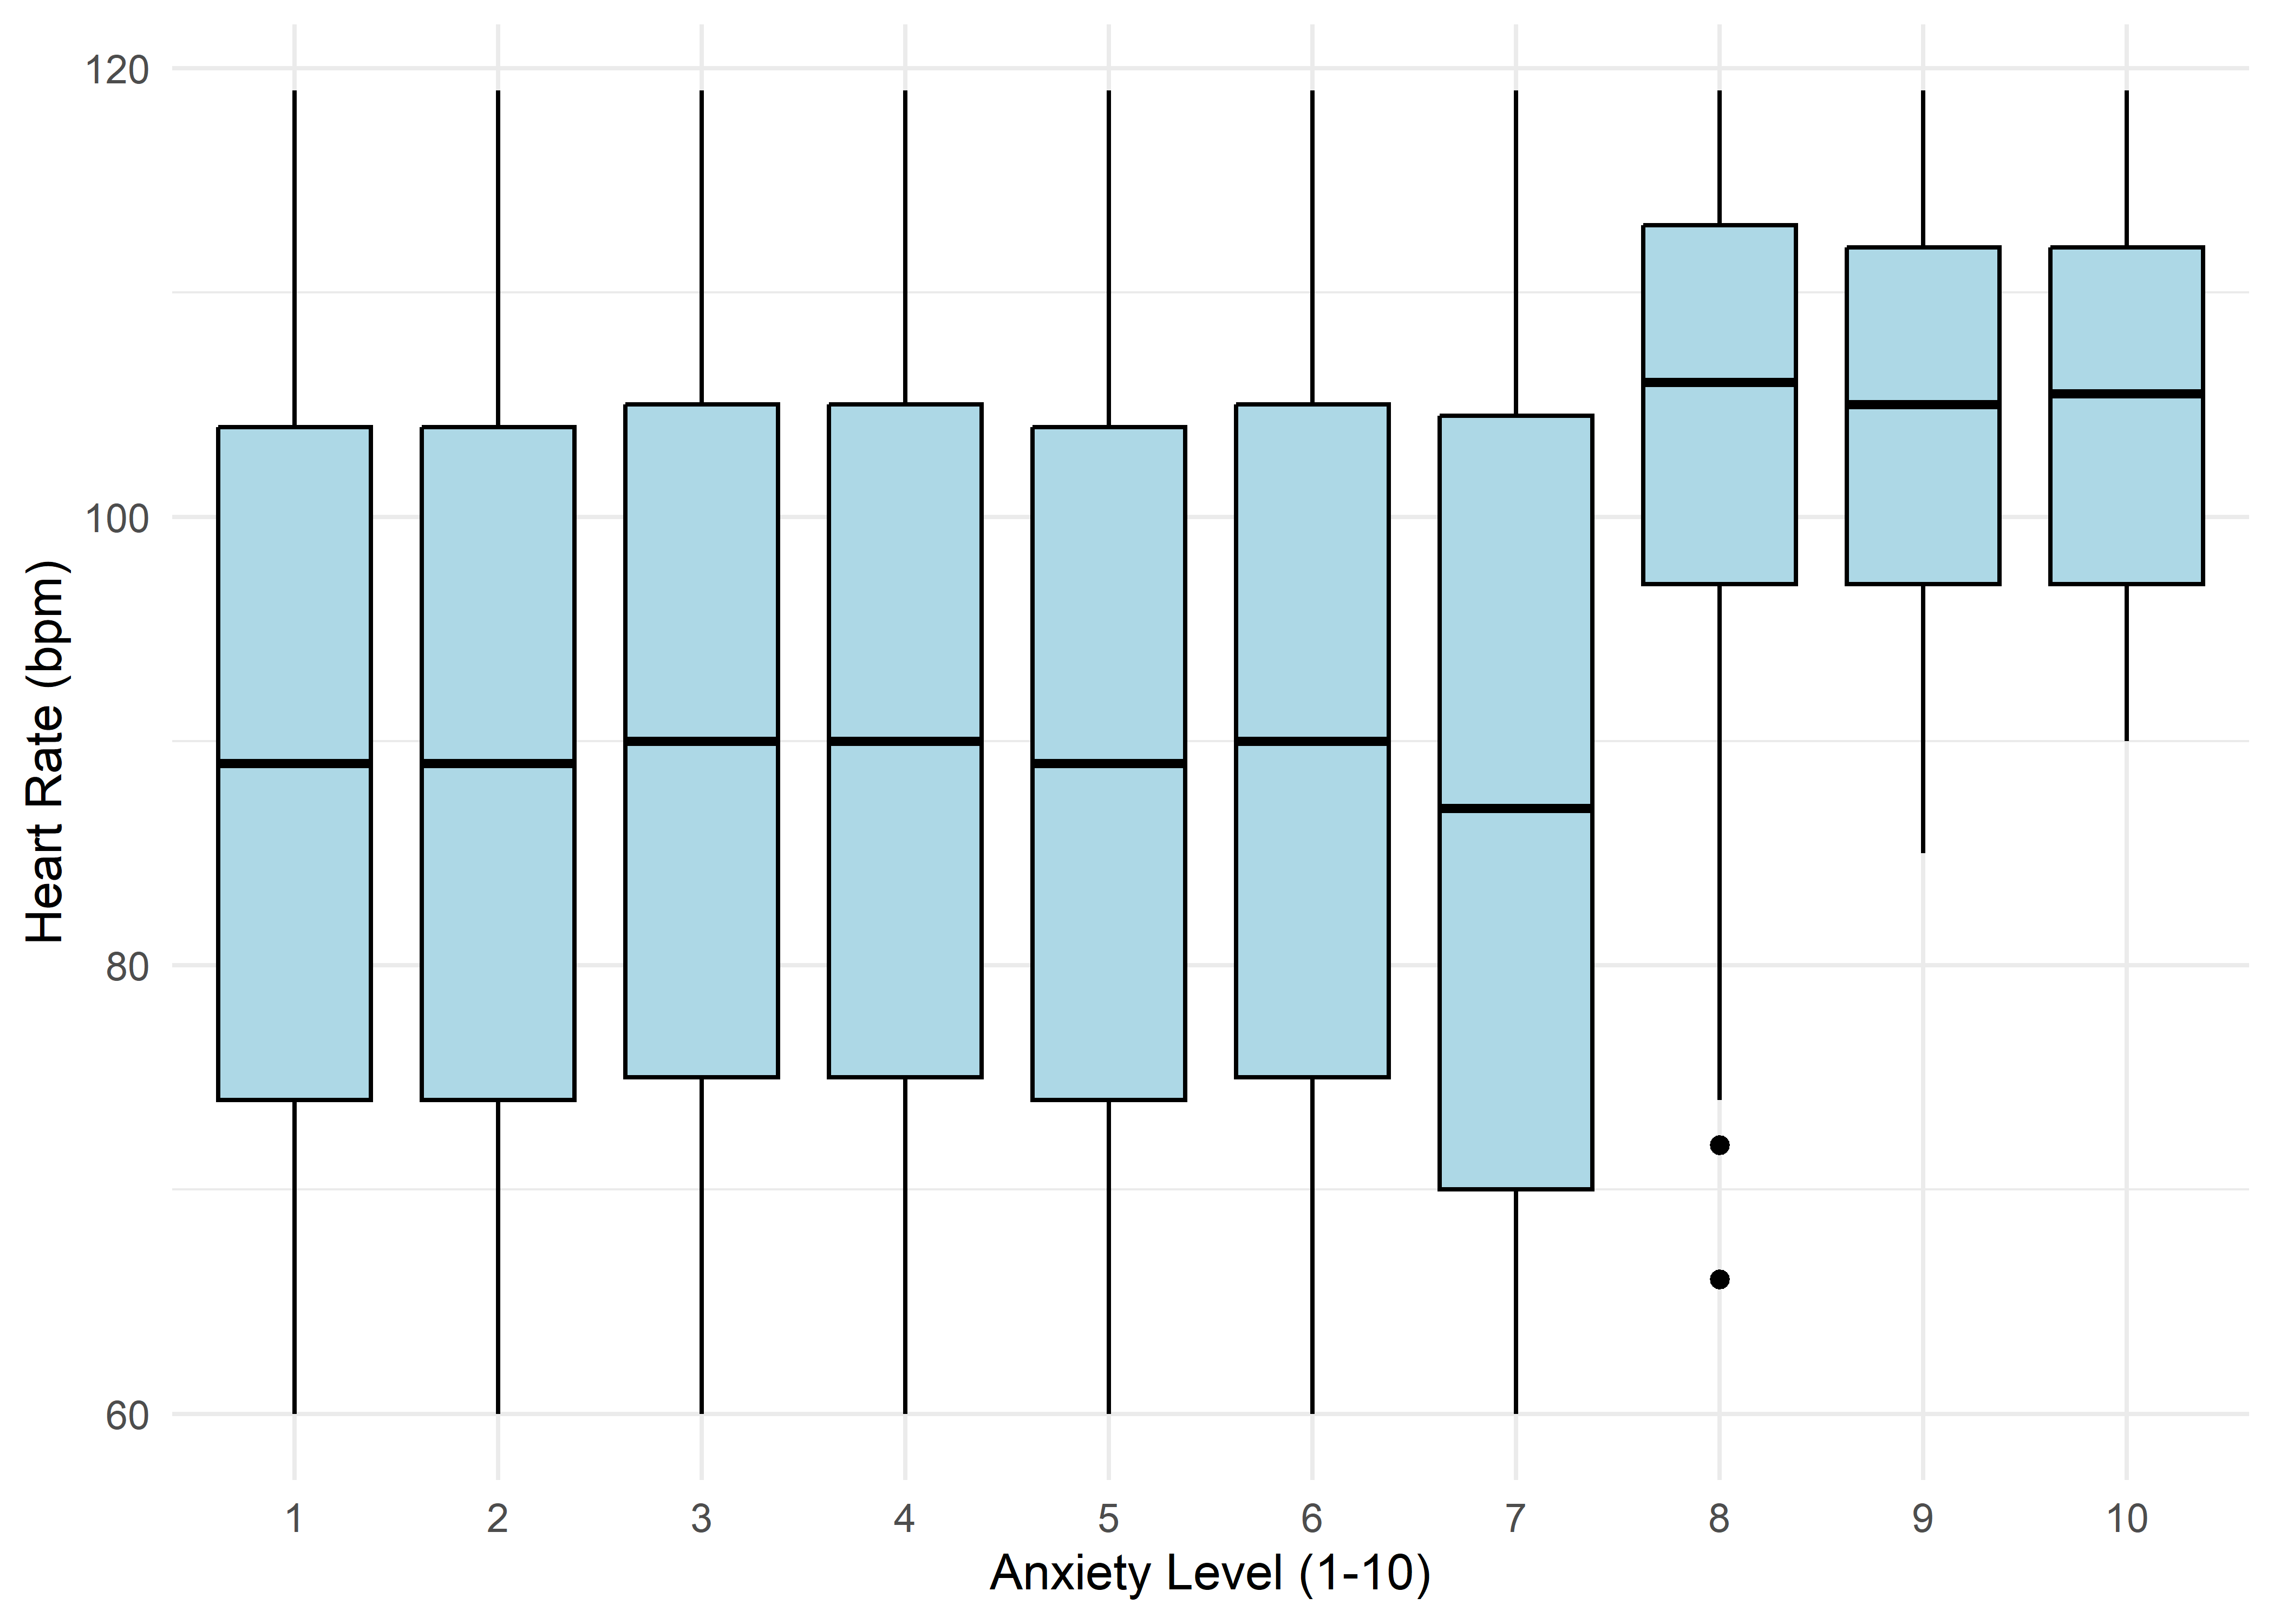
The visualizations suggest that anxiety levels 8–10 may form a distinct subgroup. Across many variables, these levels appear to behave differently from levels 1–7. We summarize the key differences below.
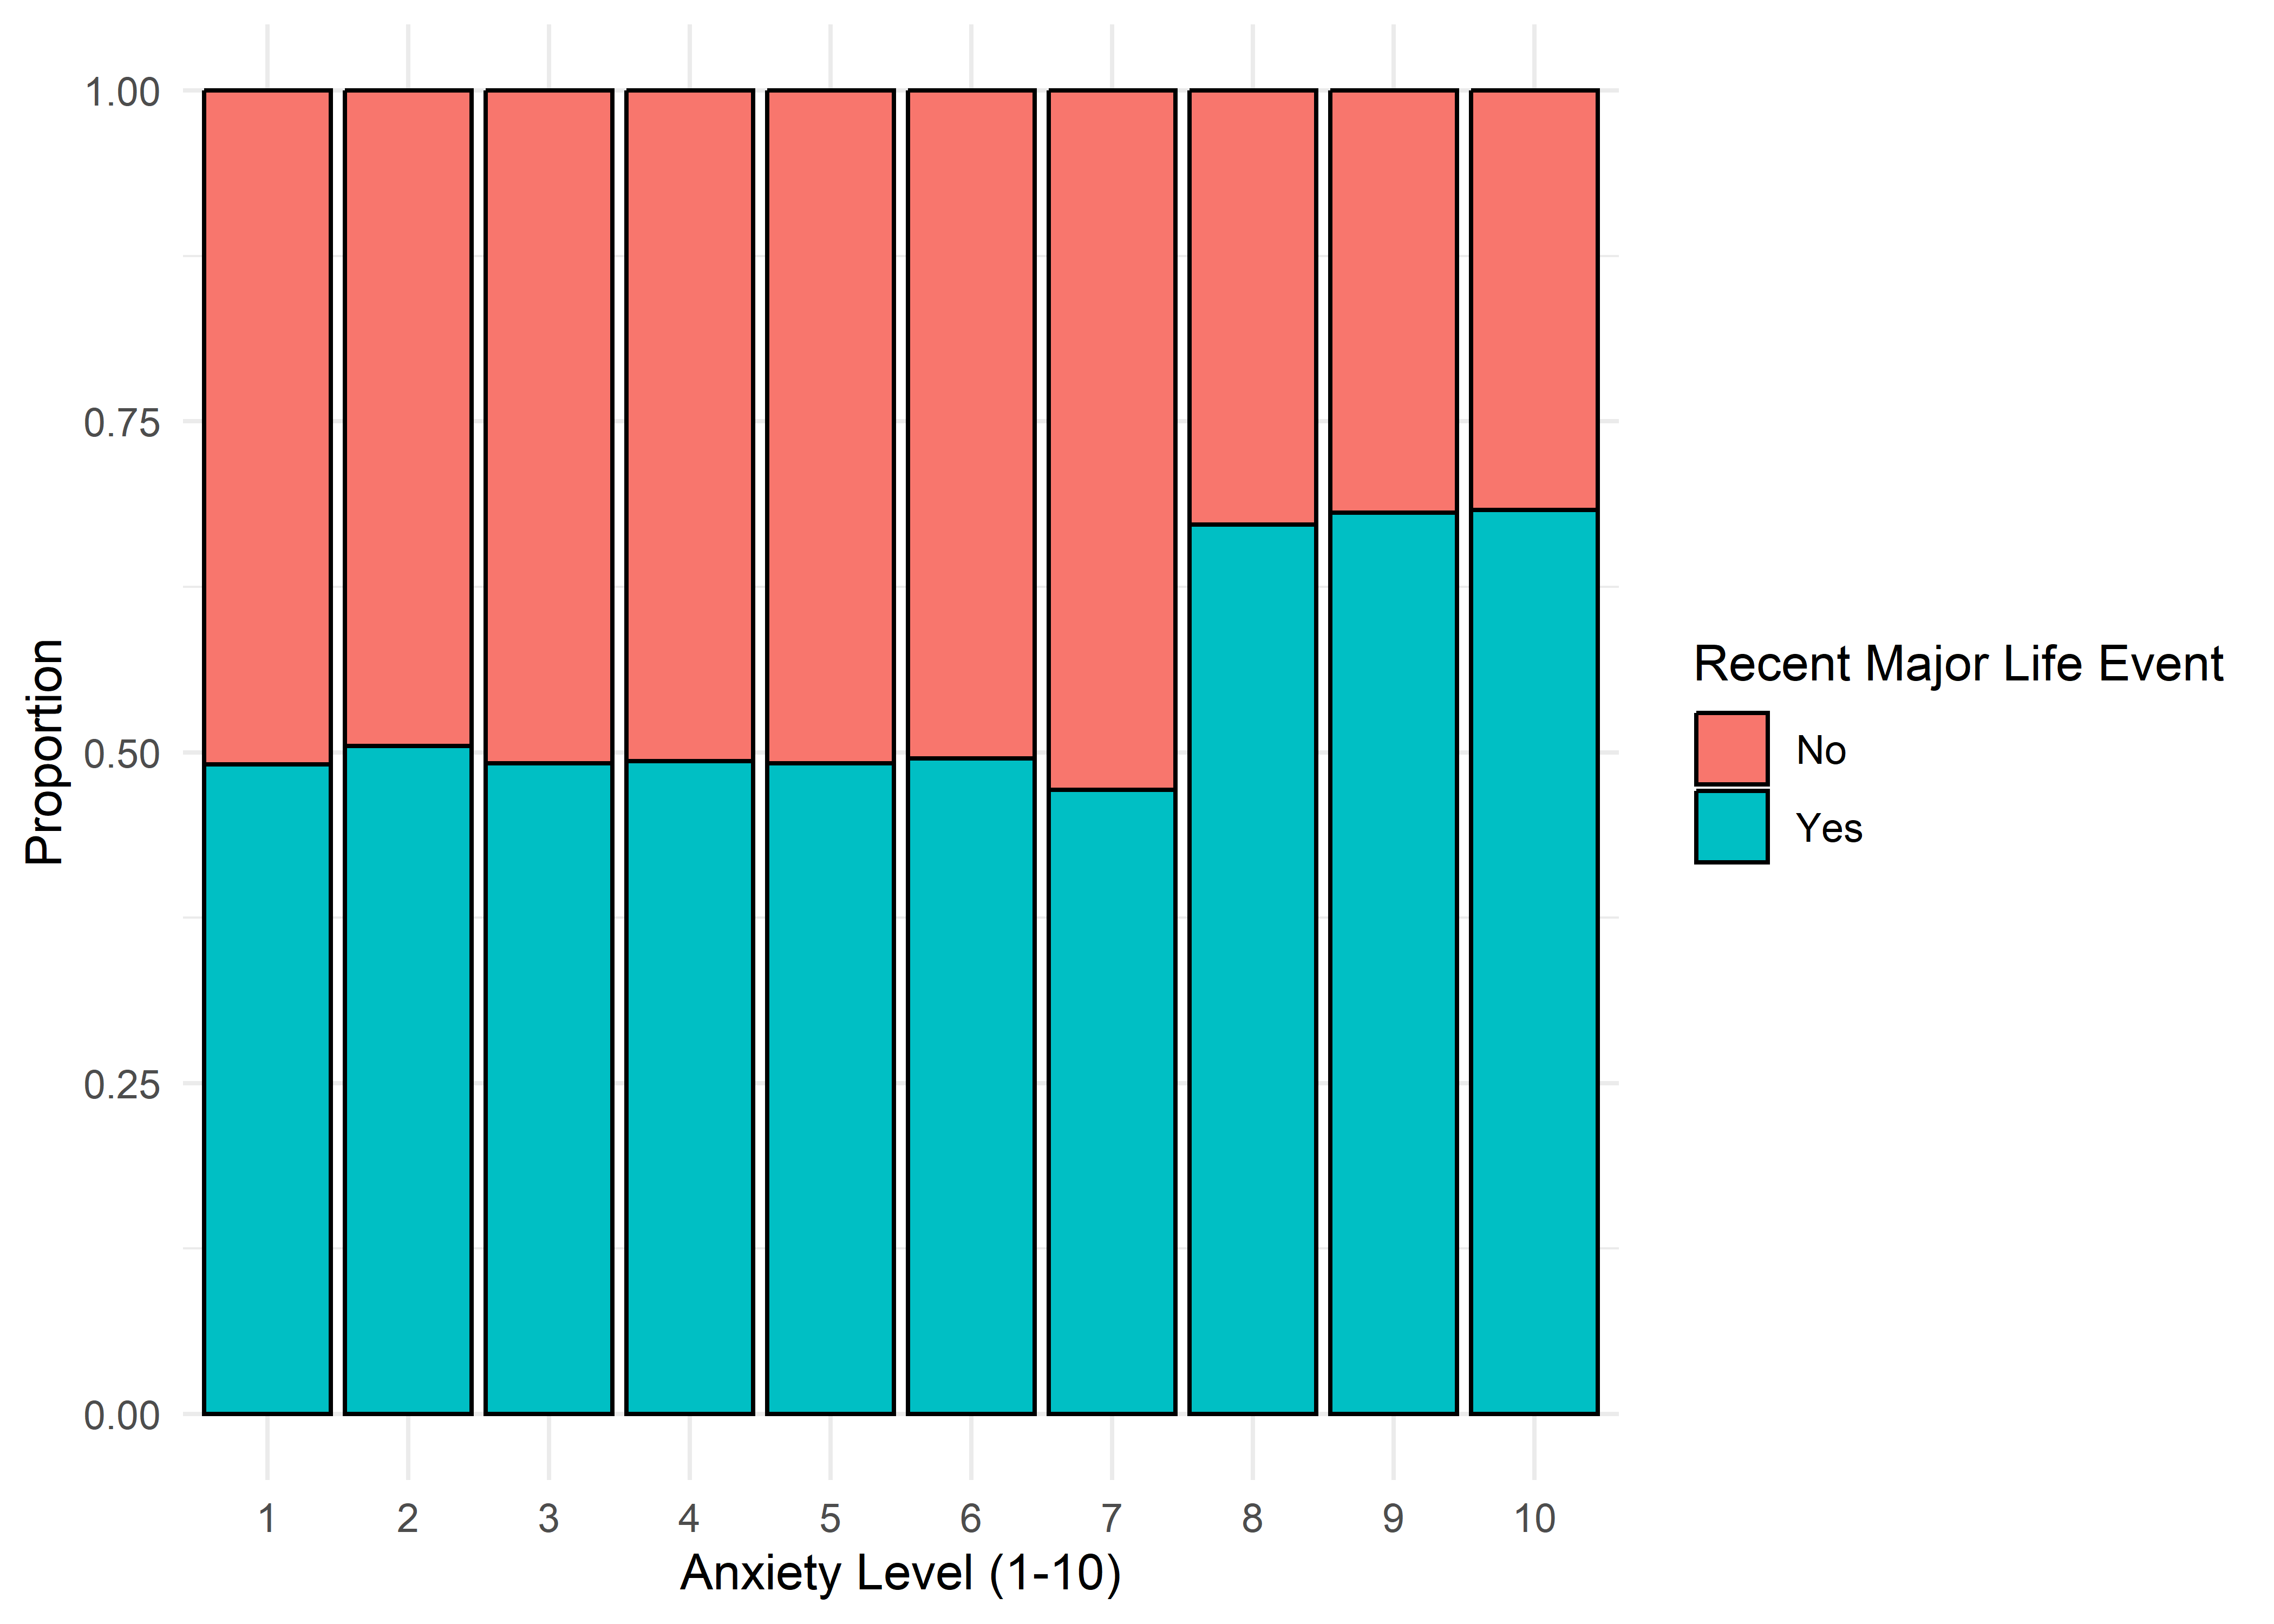
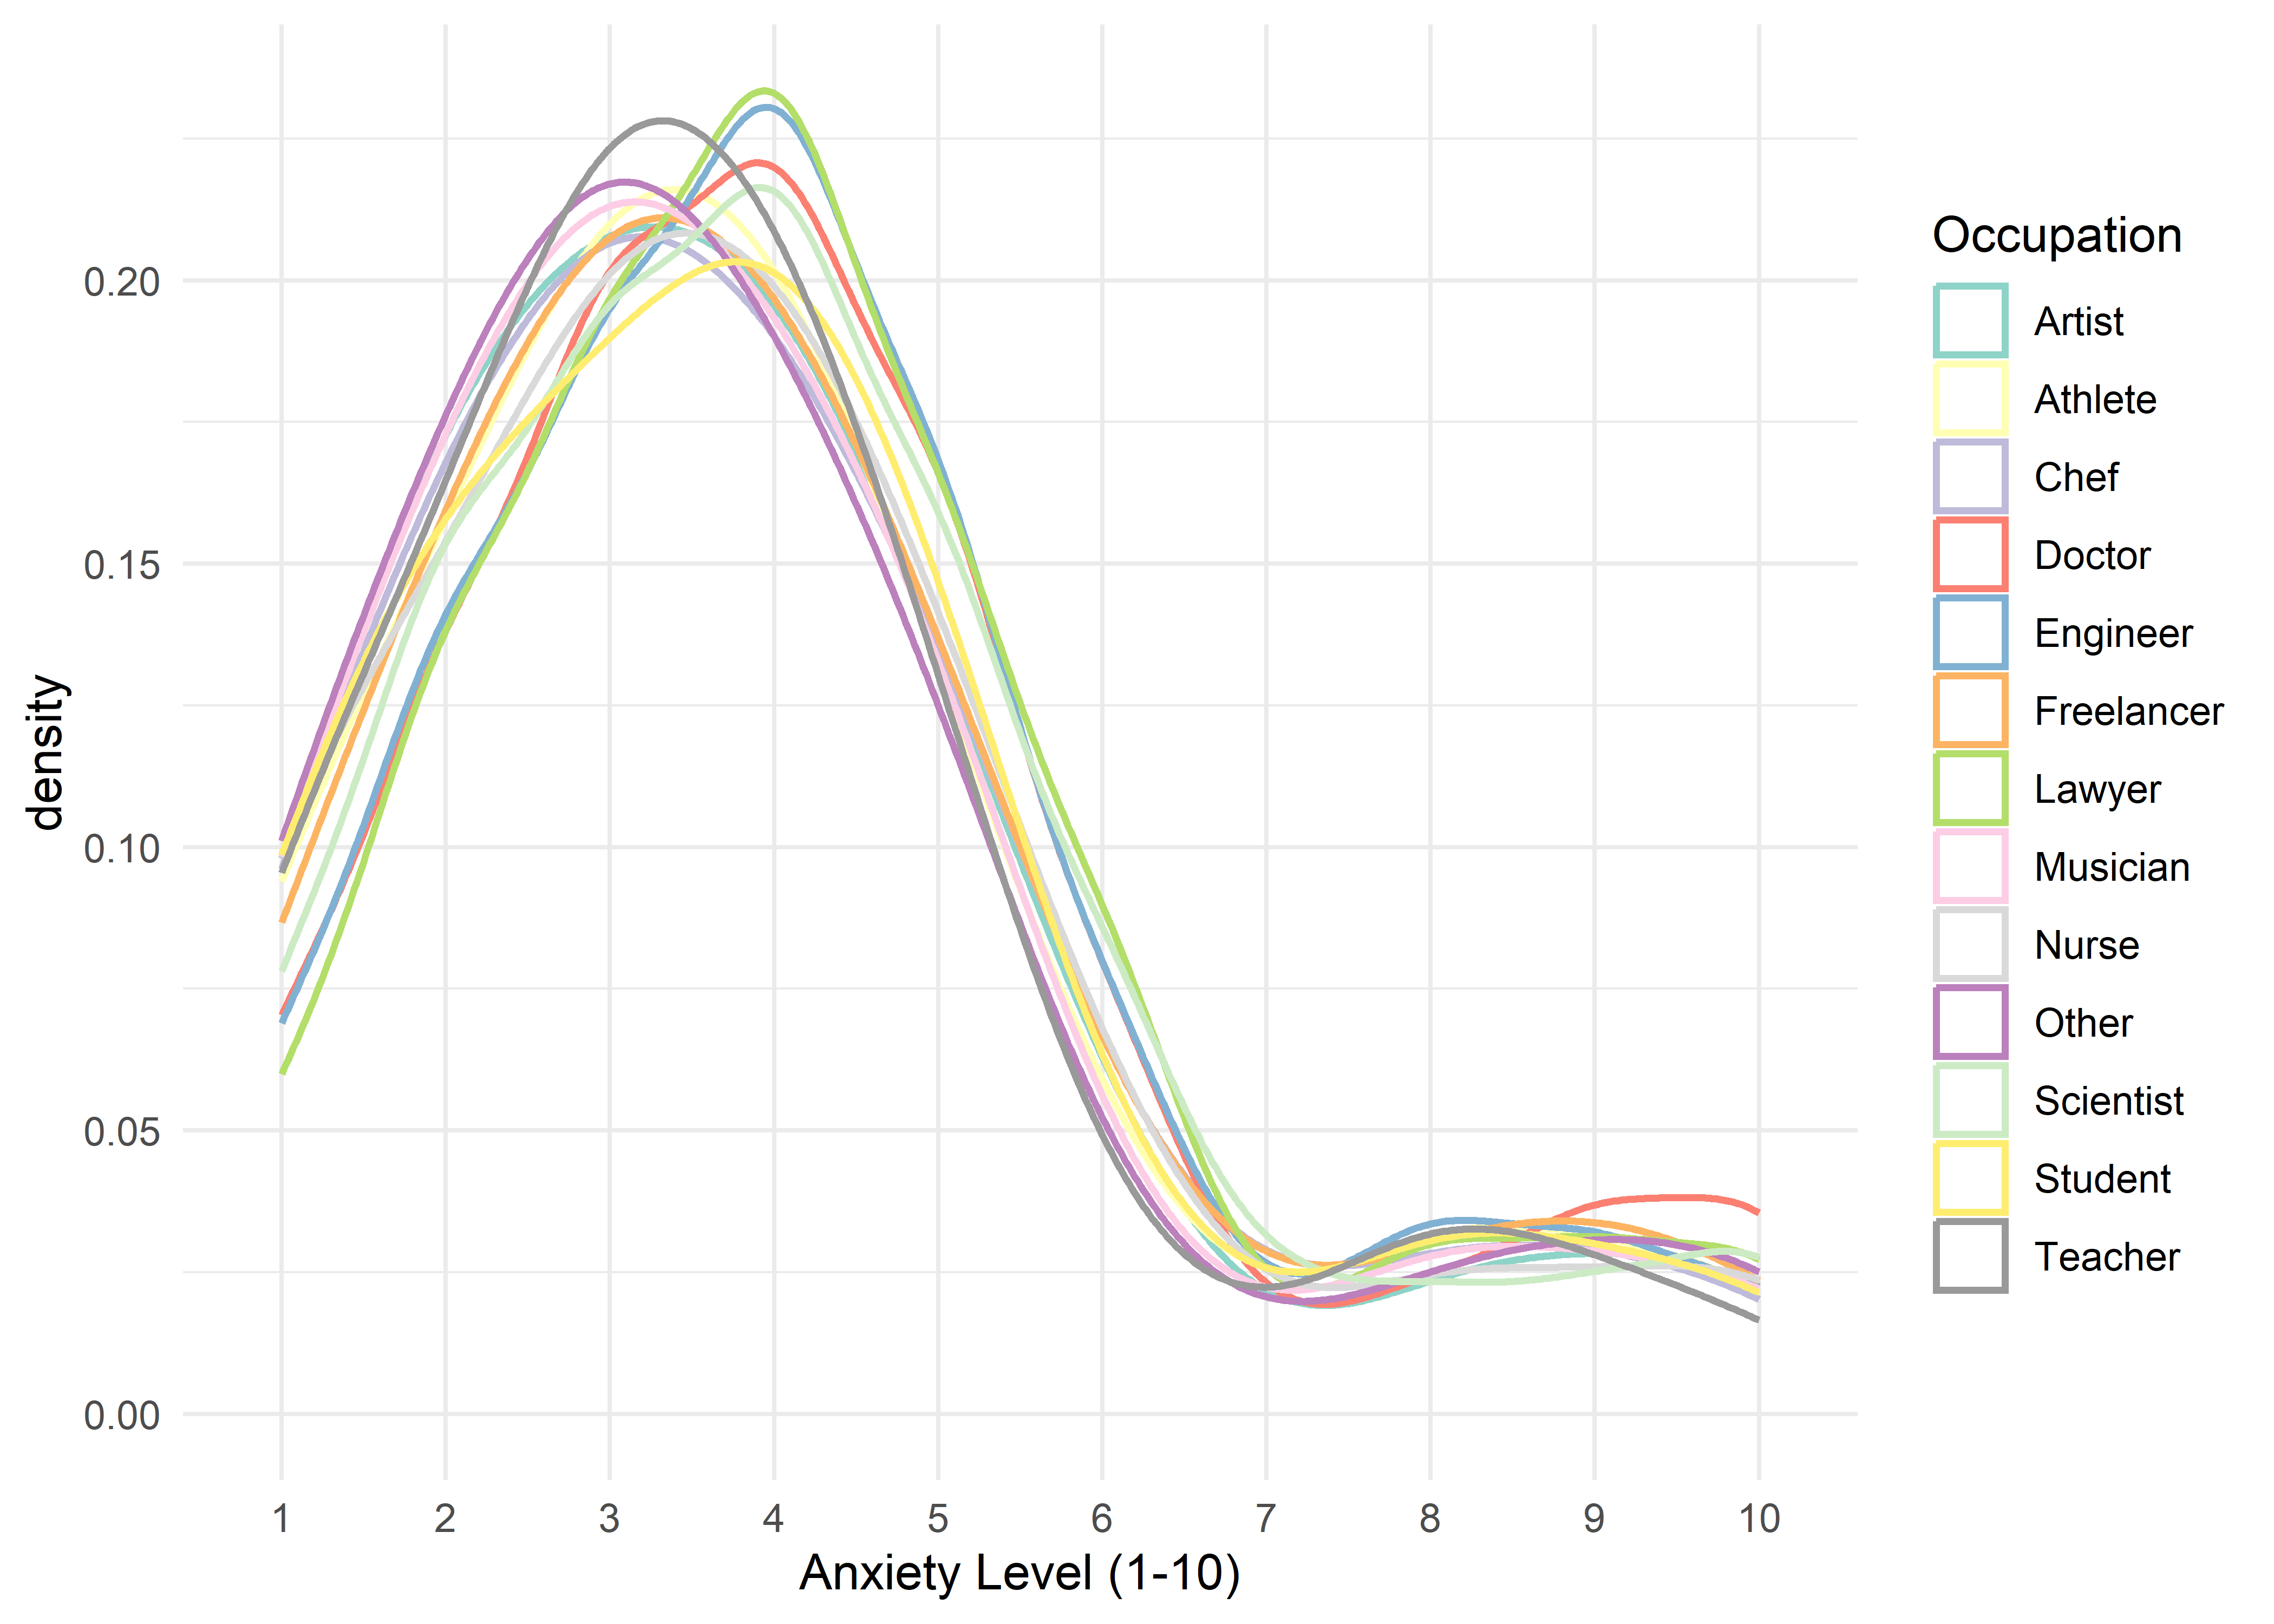
Categorical Variables
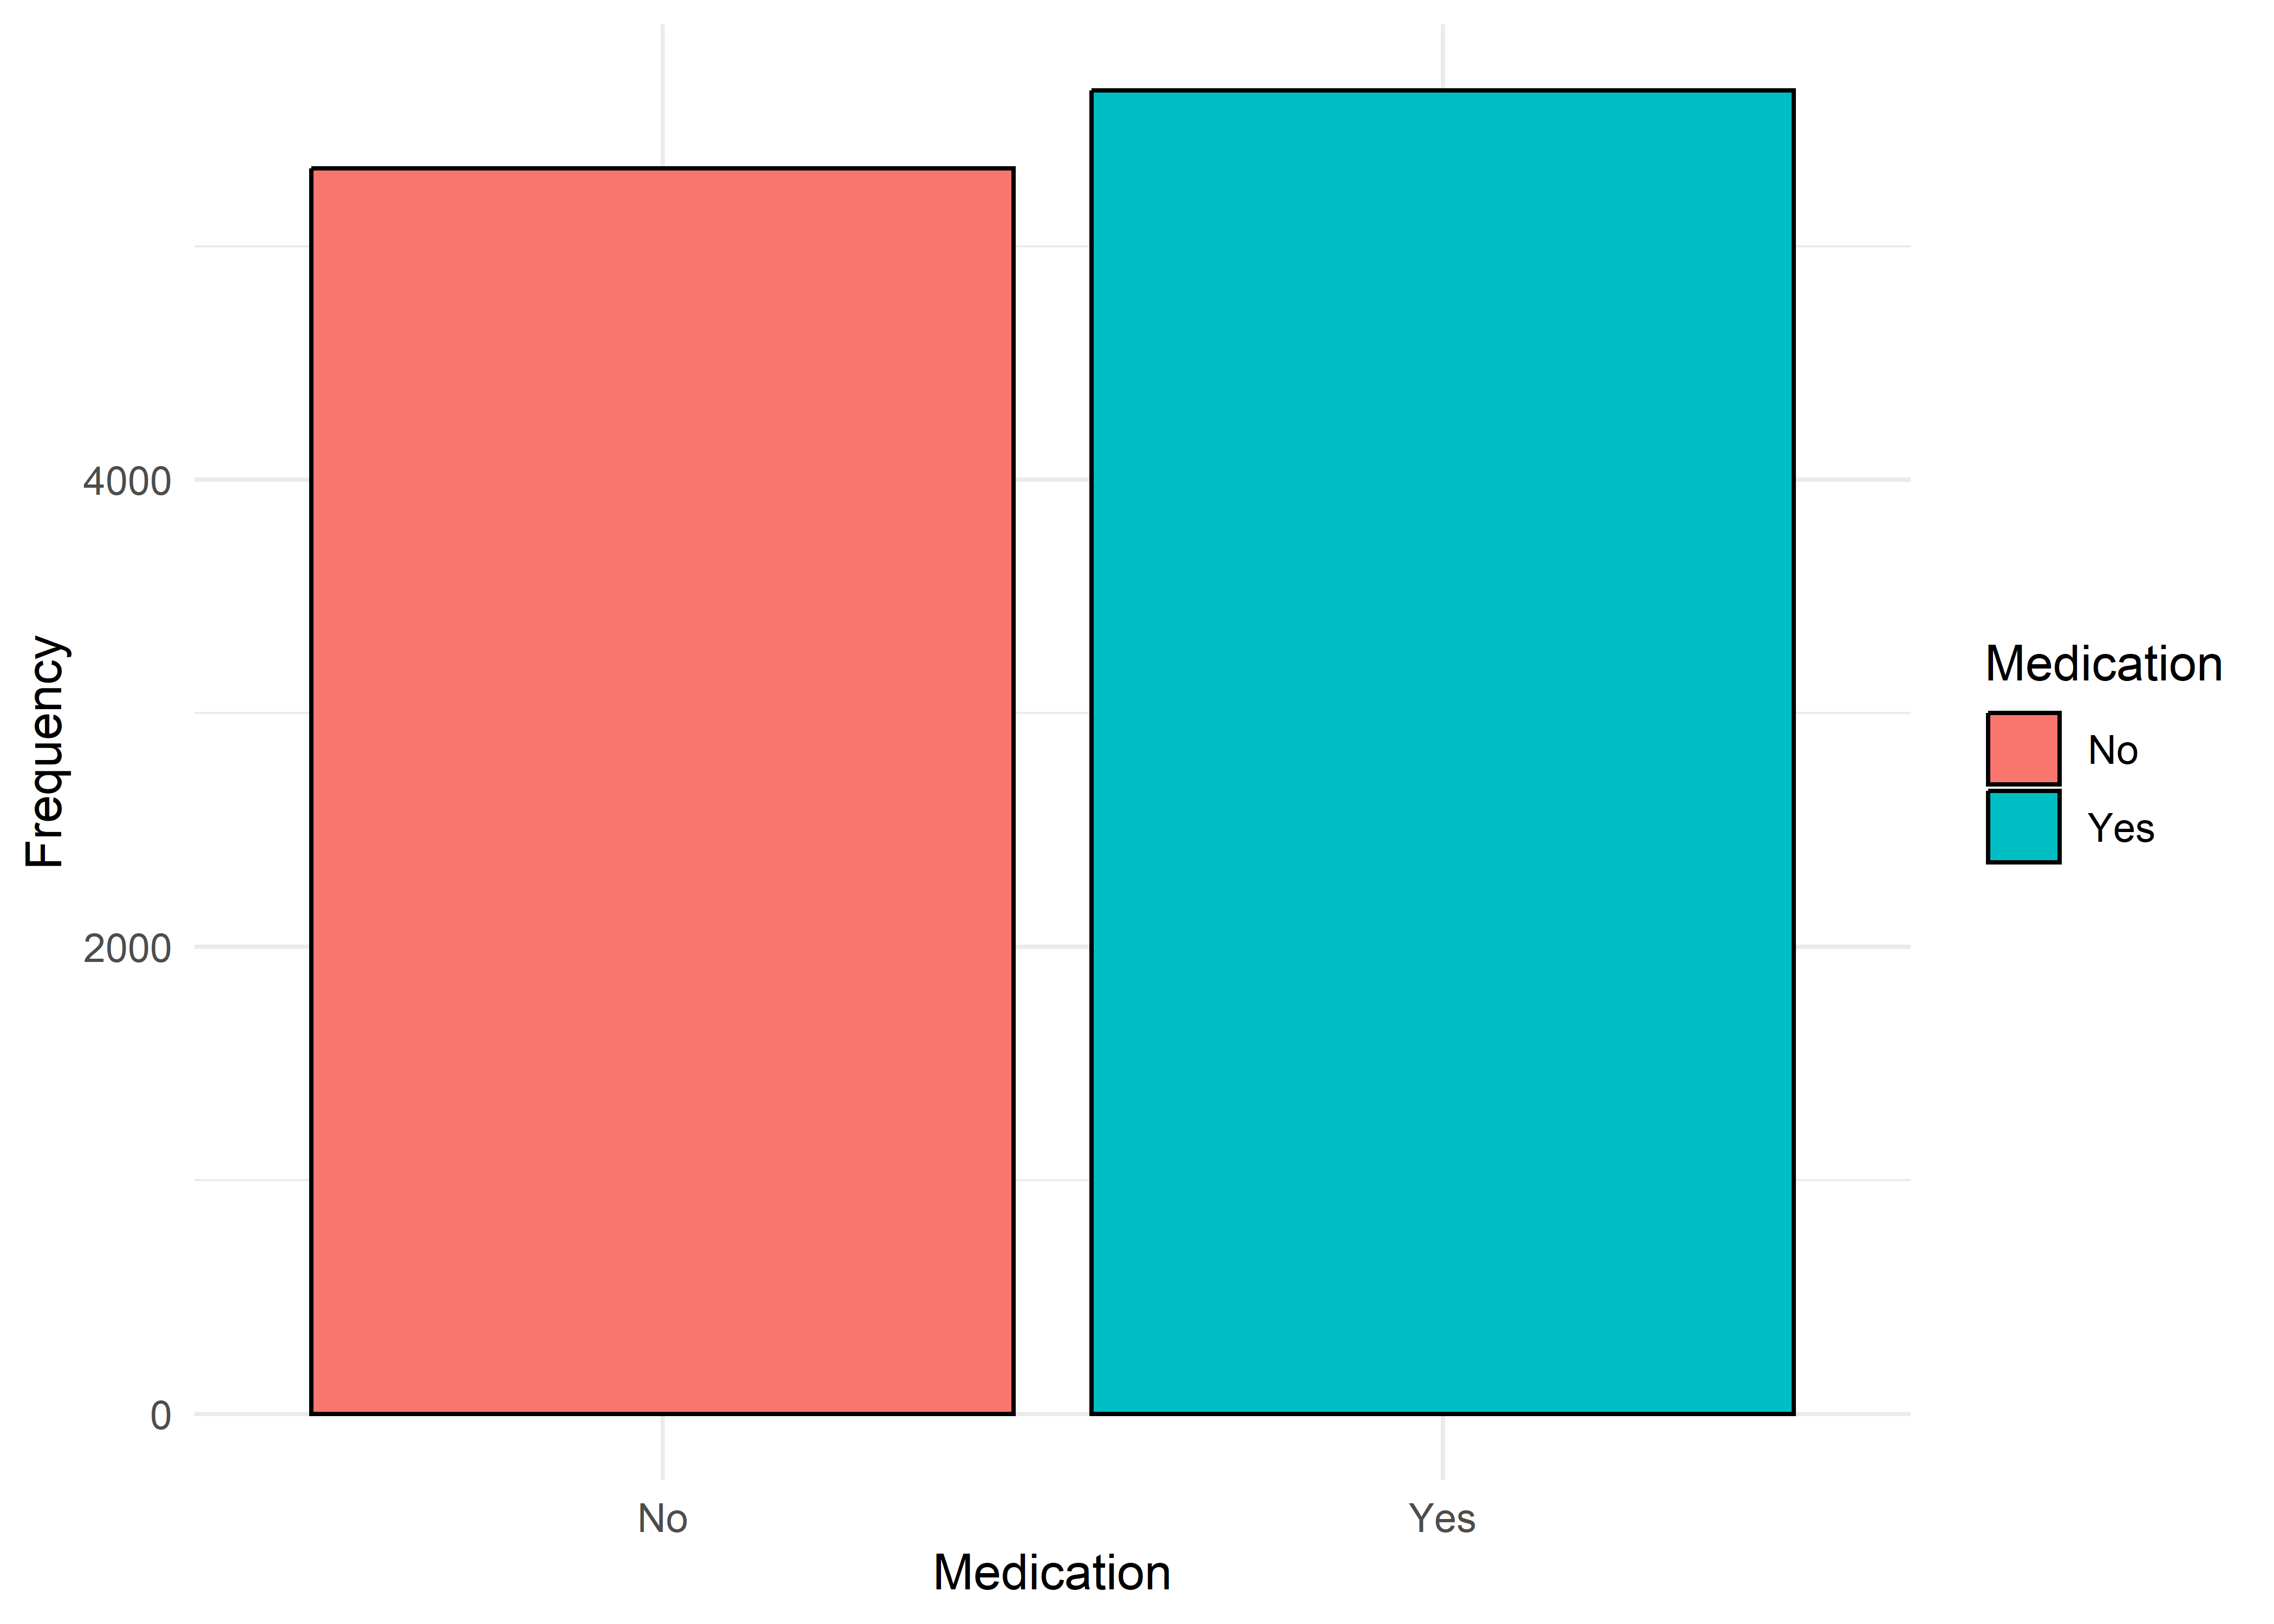
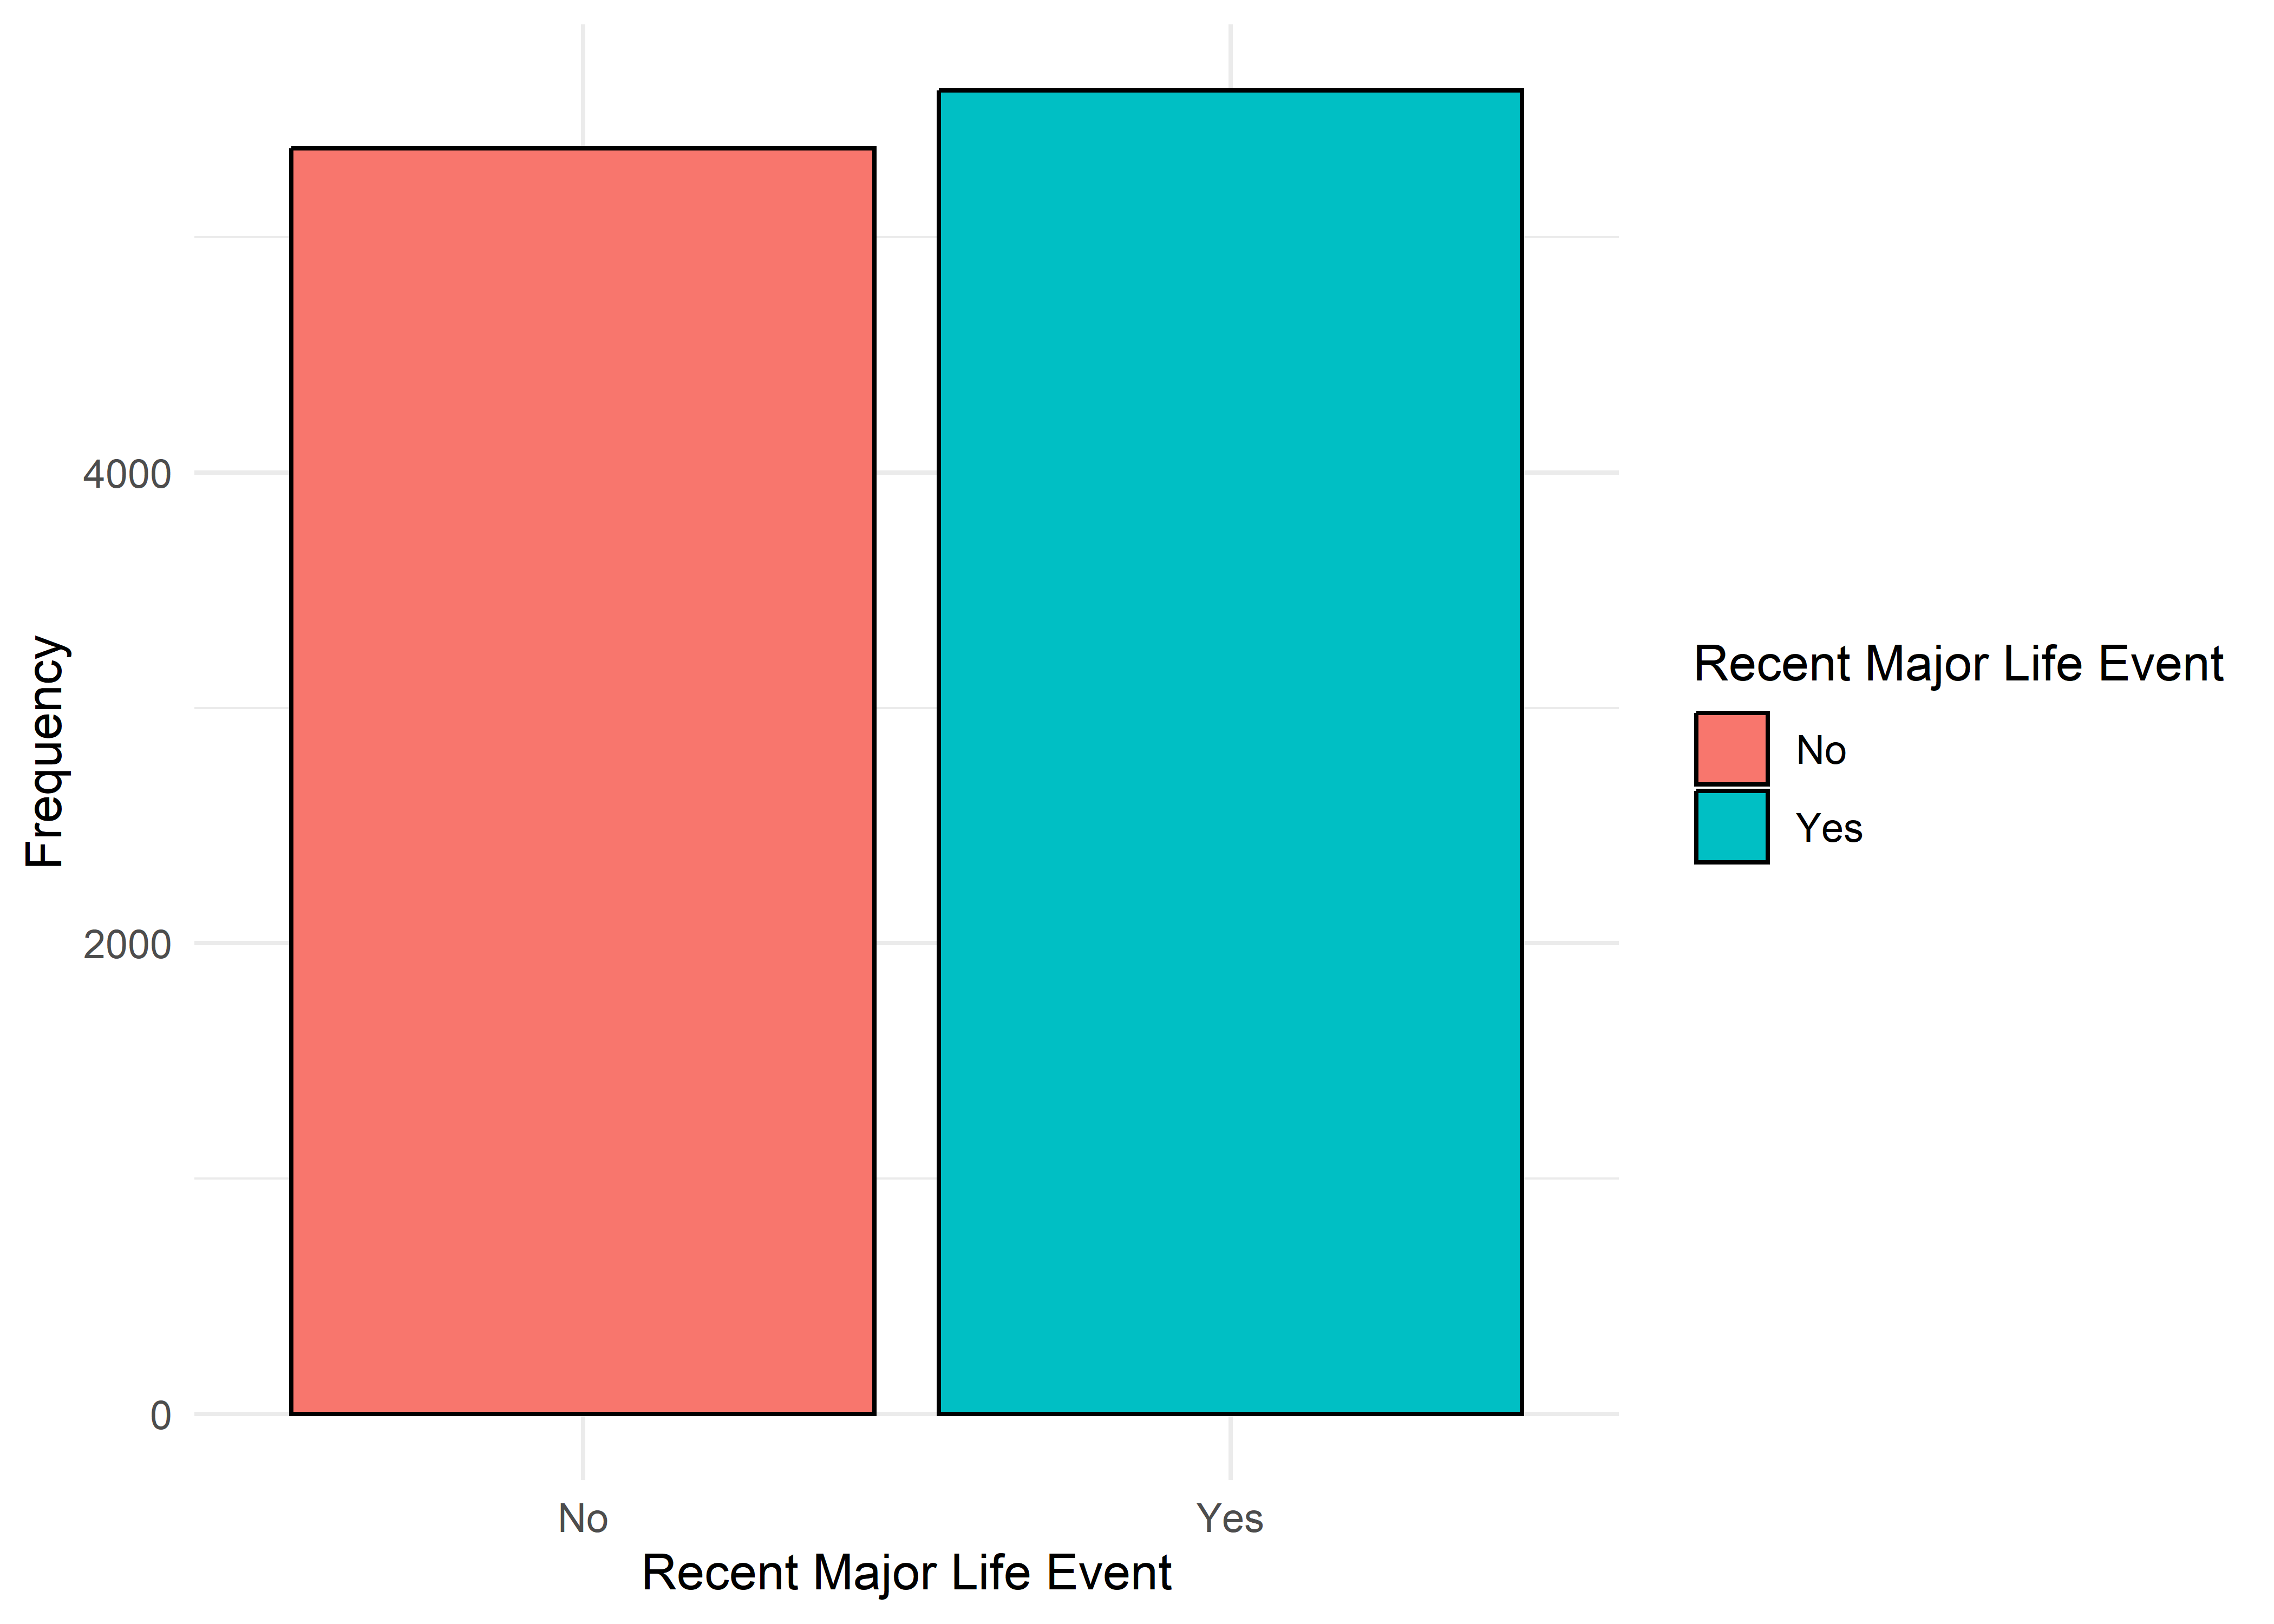
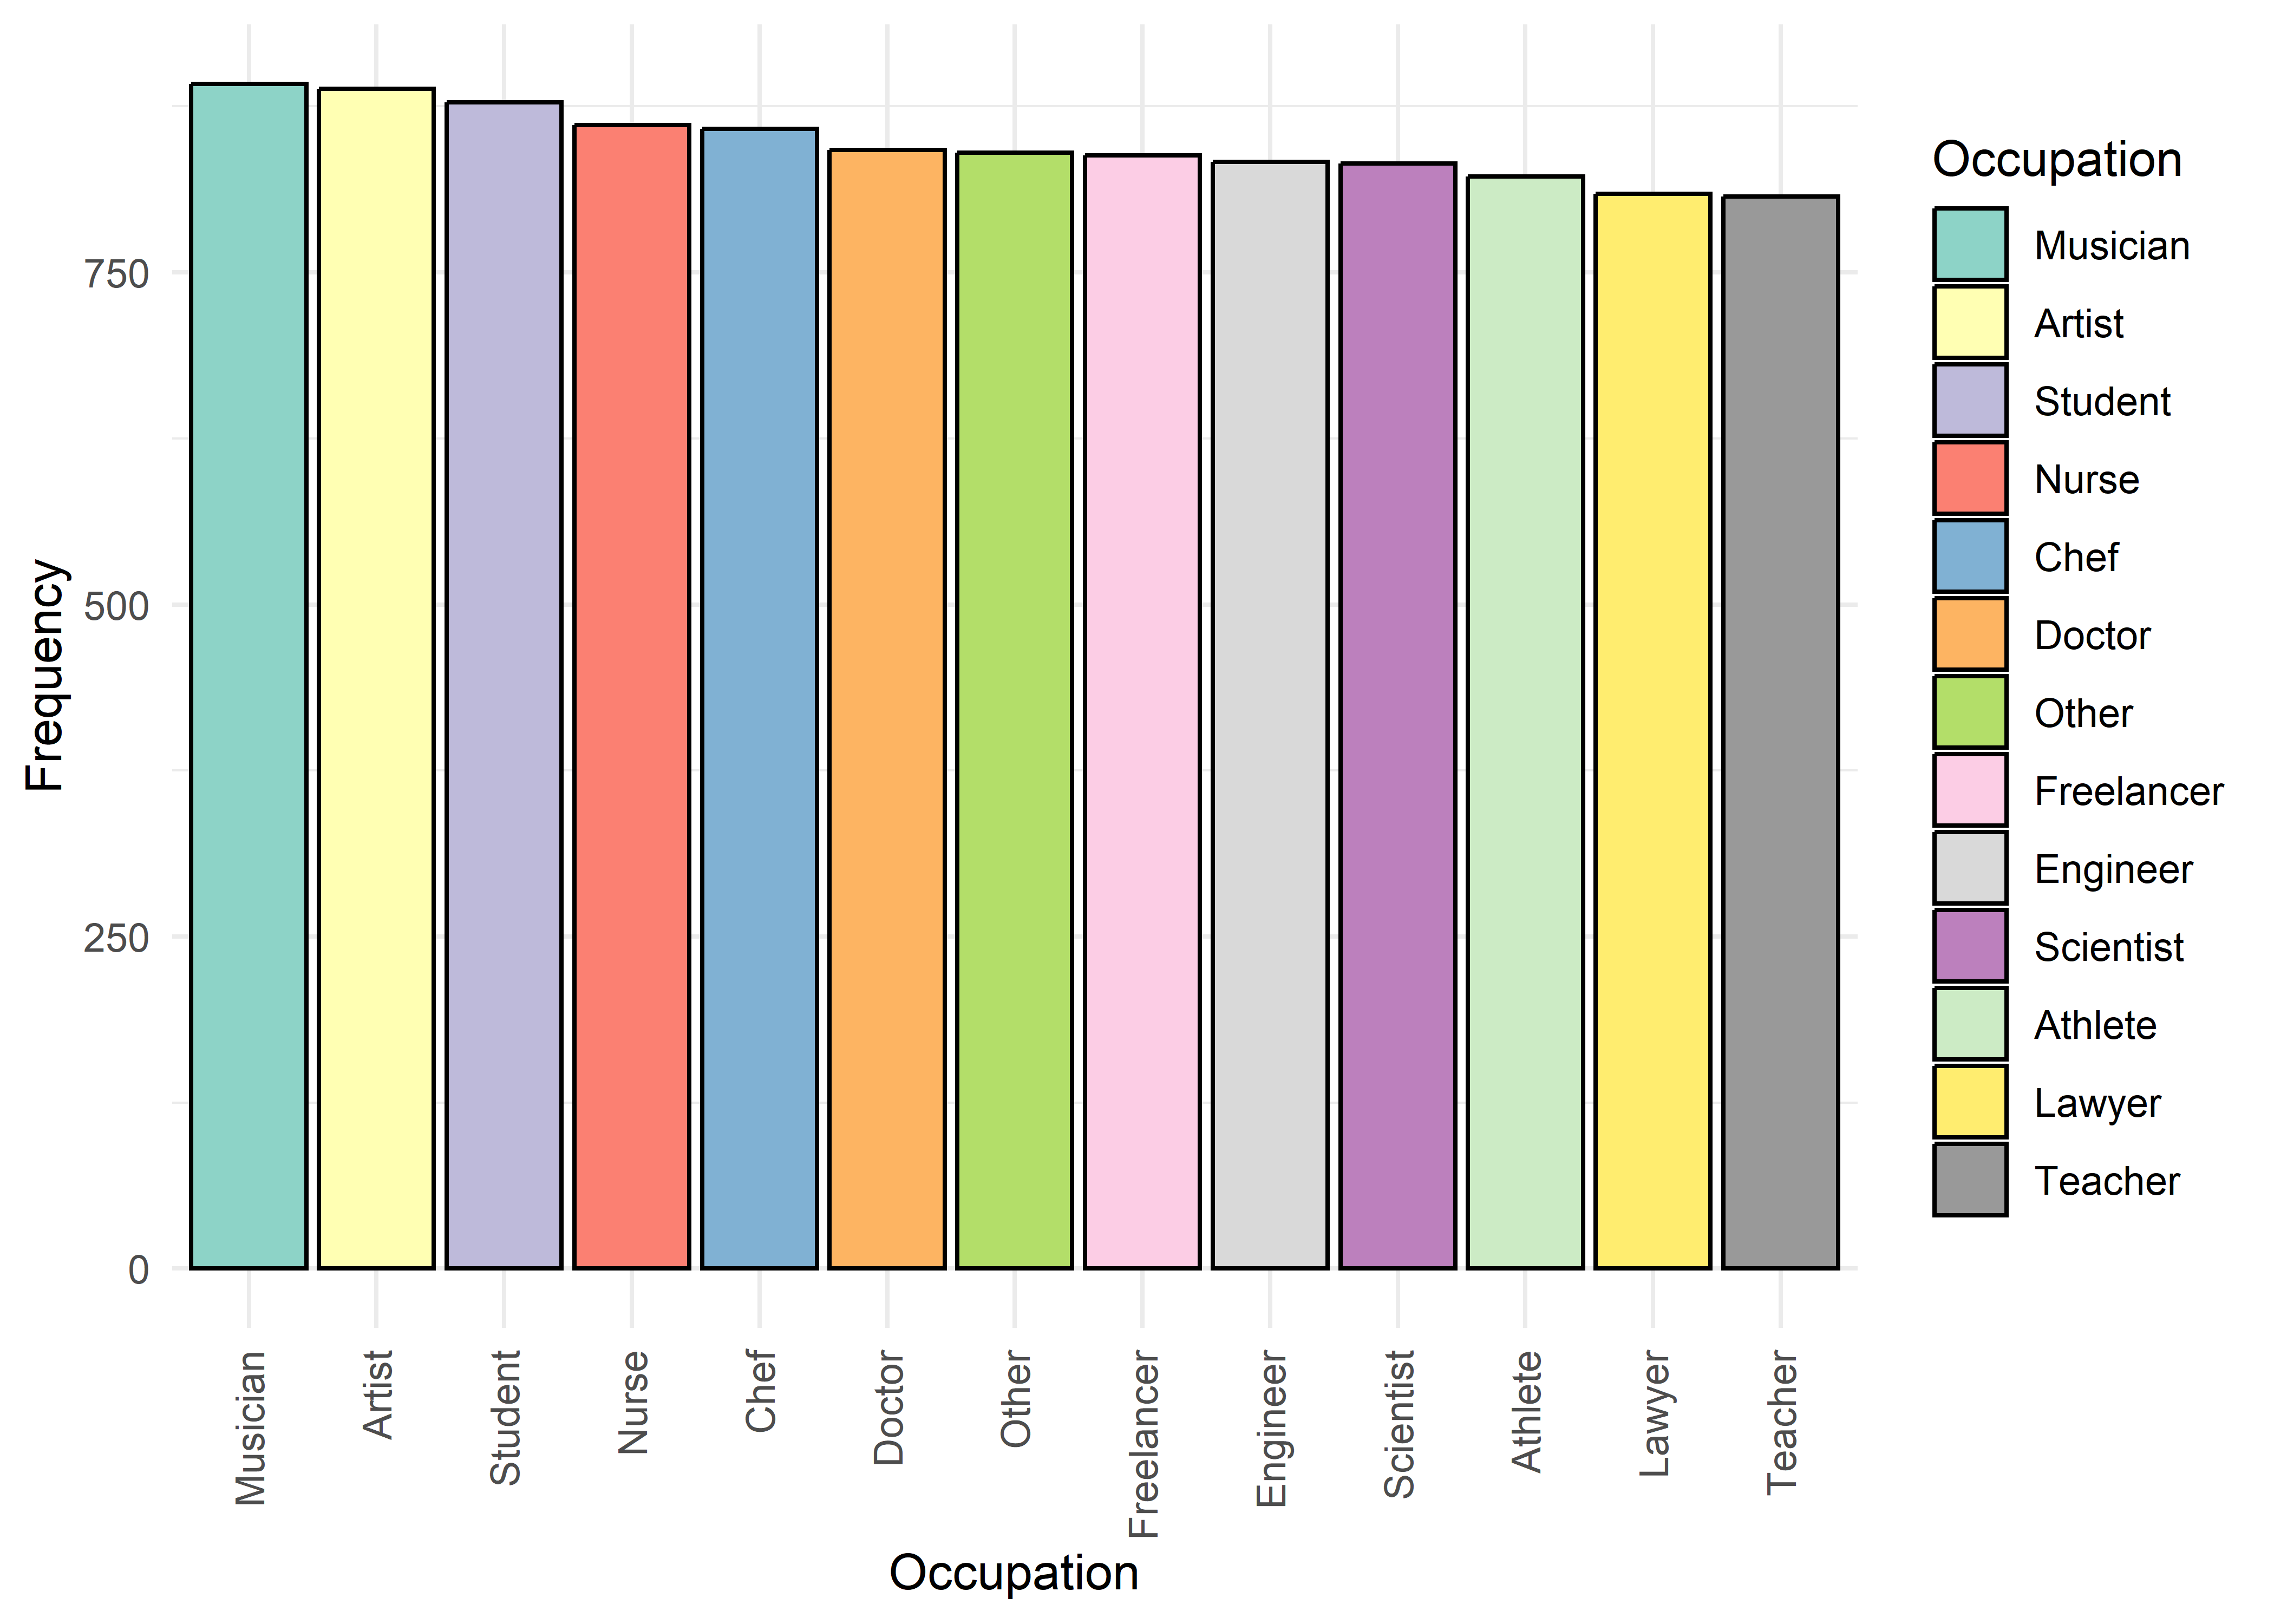
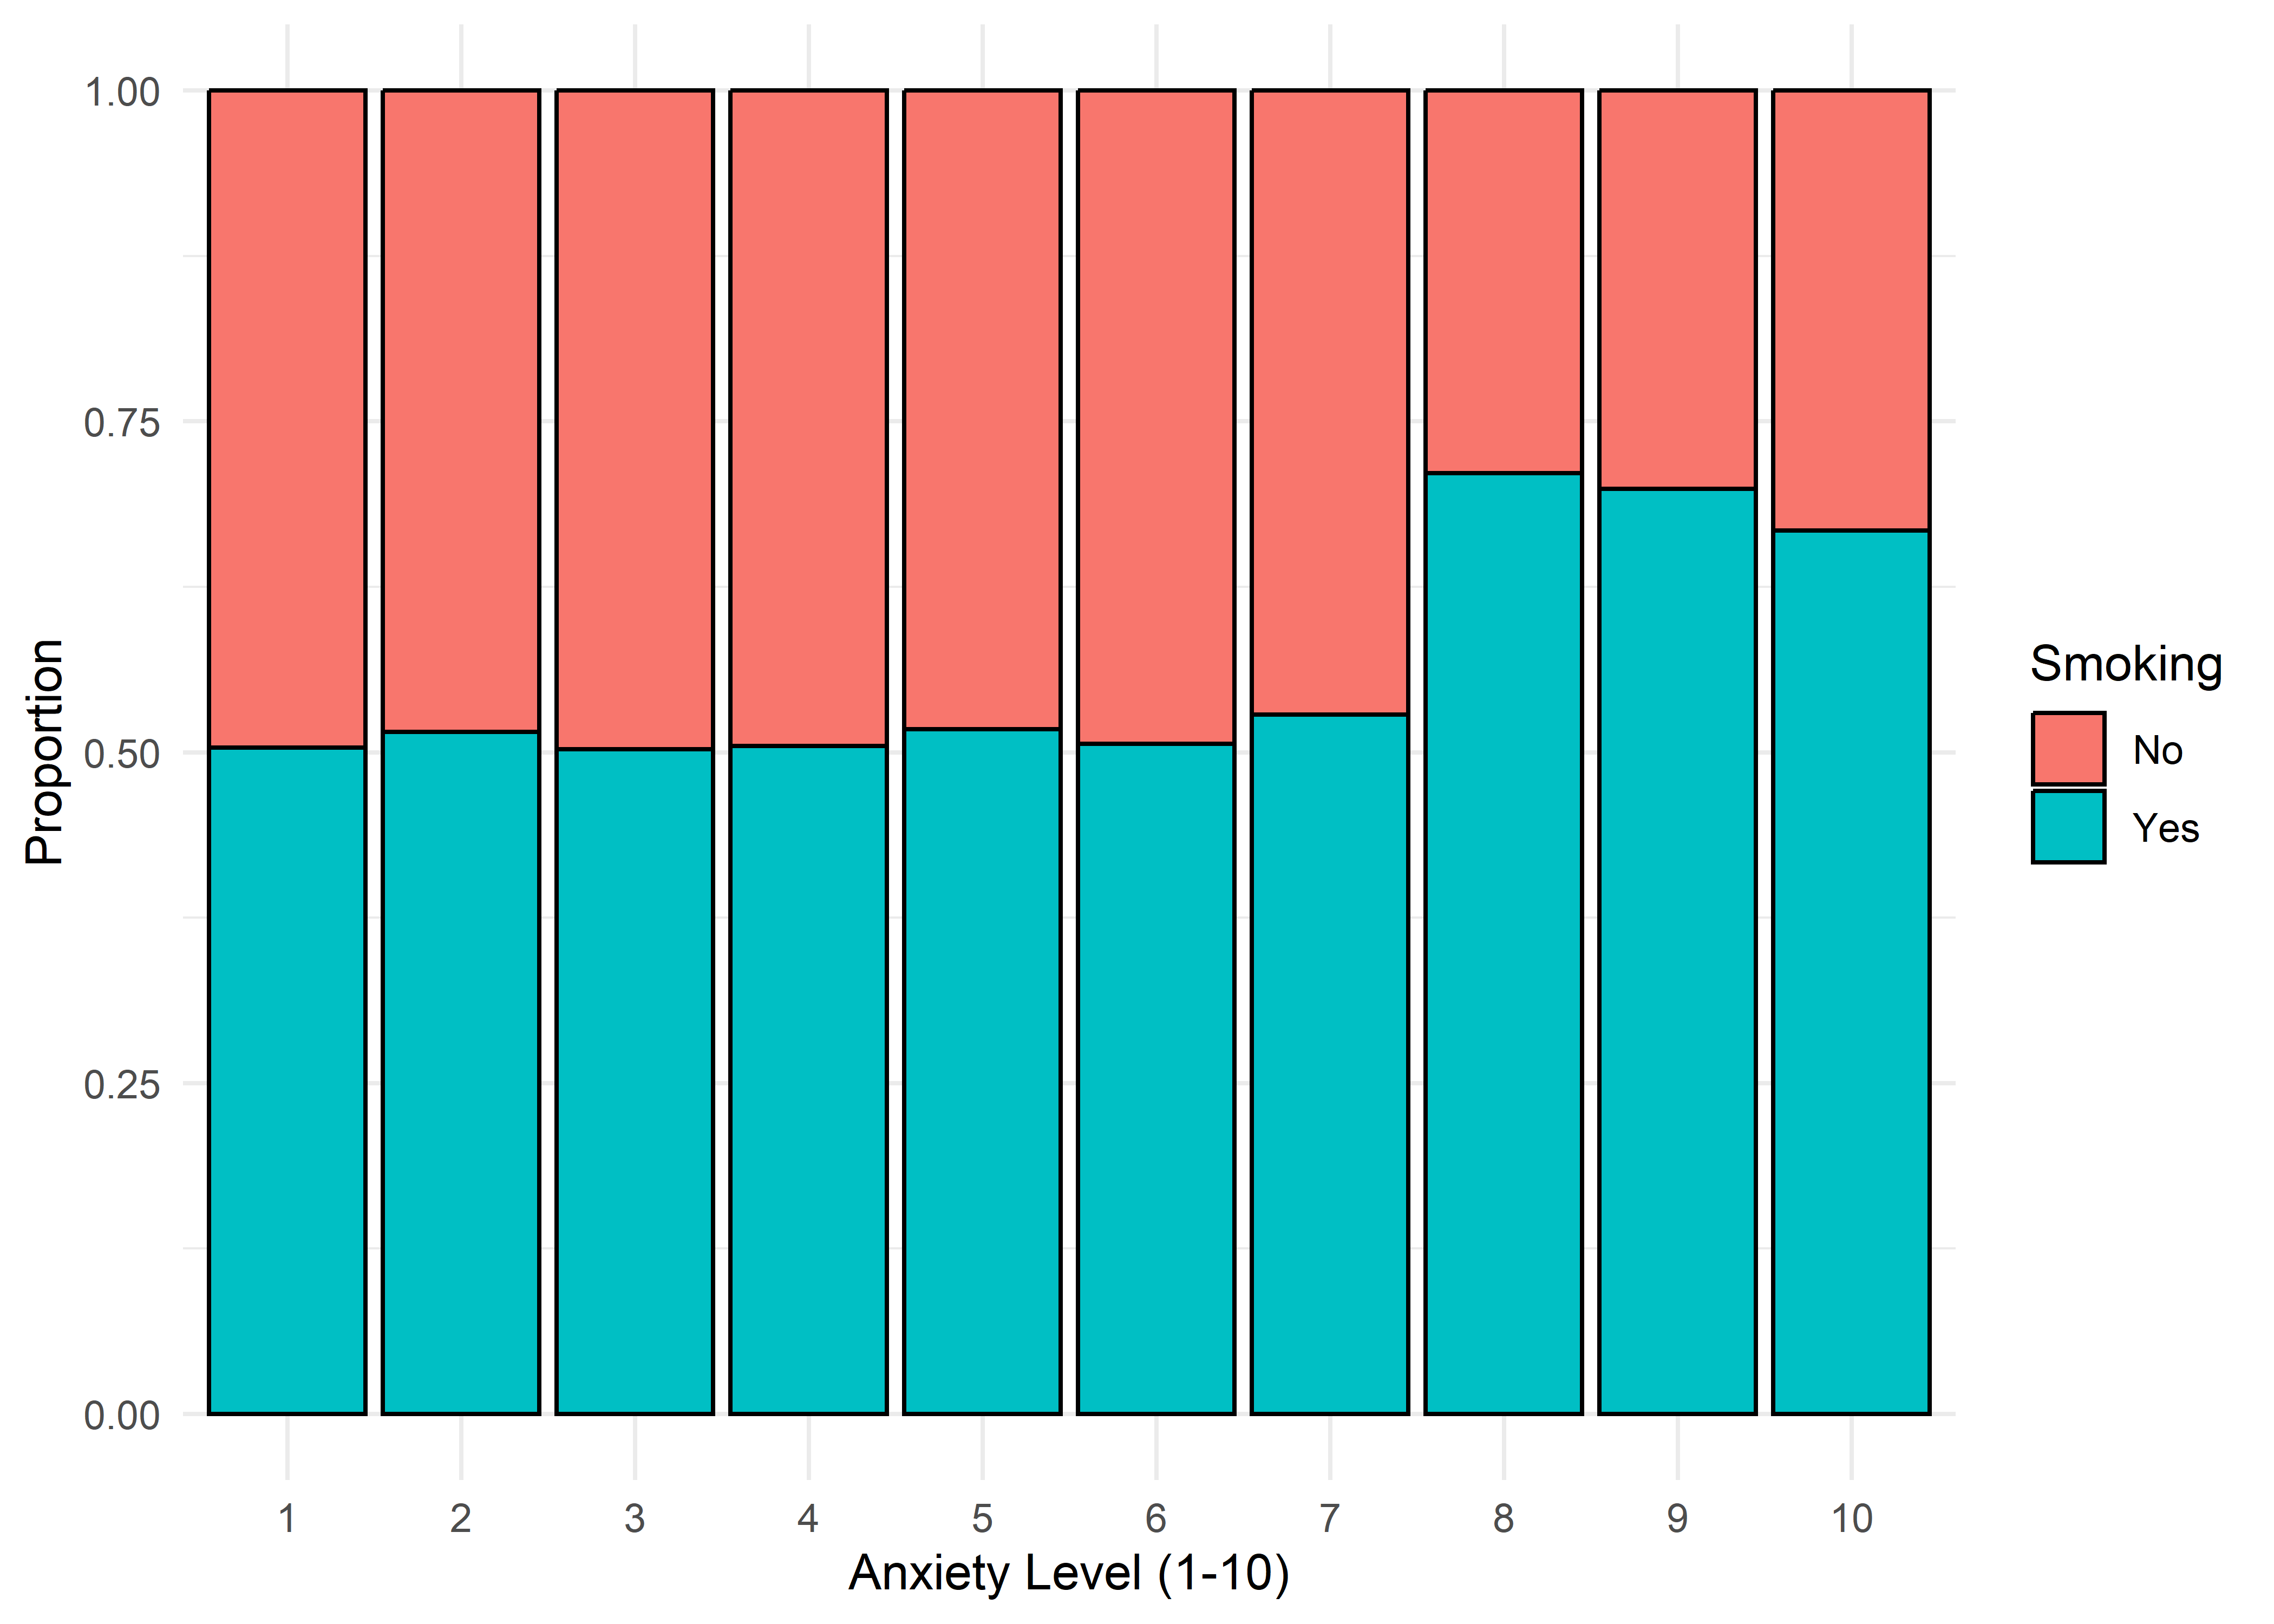
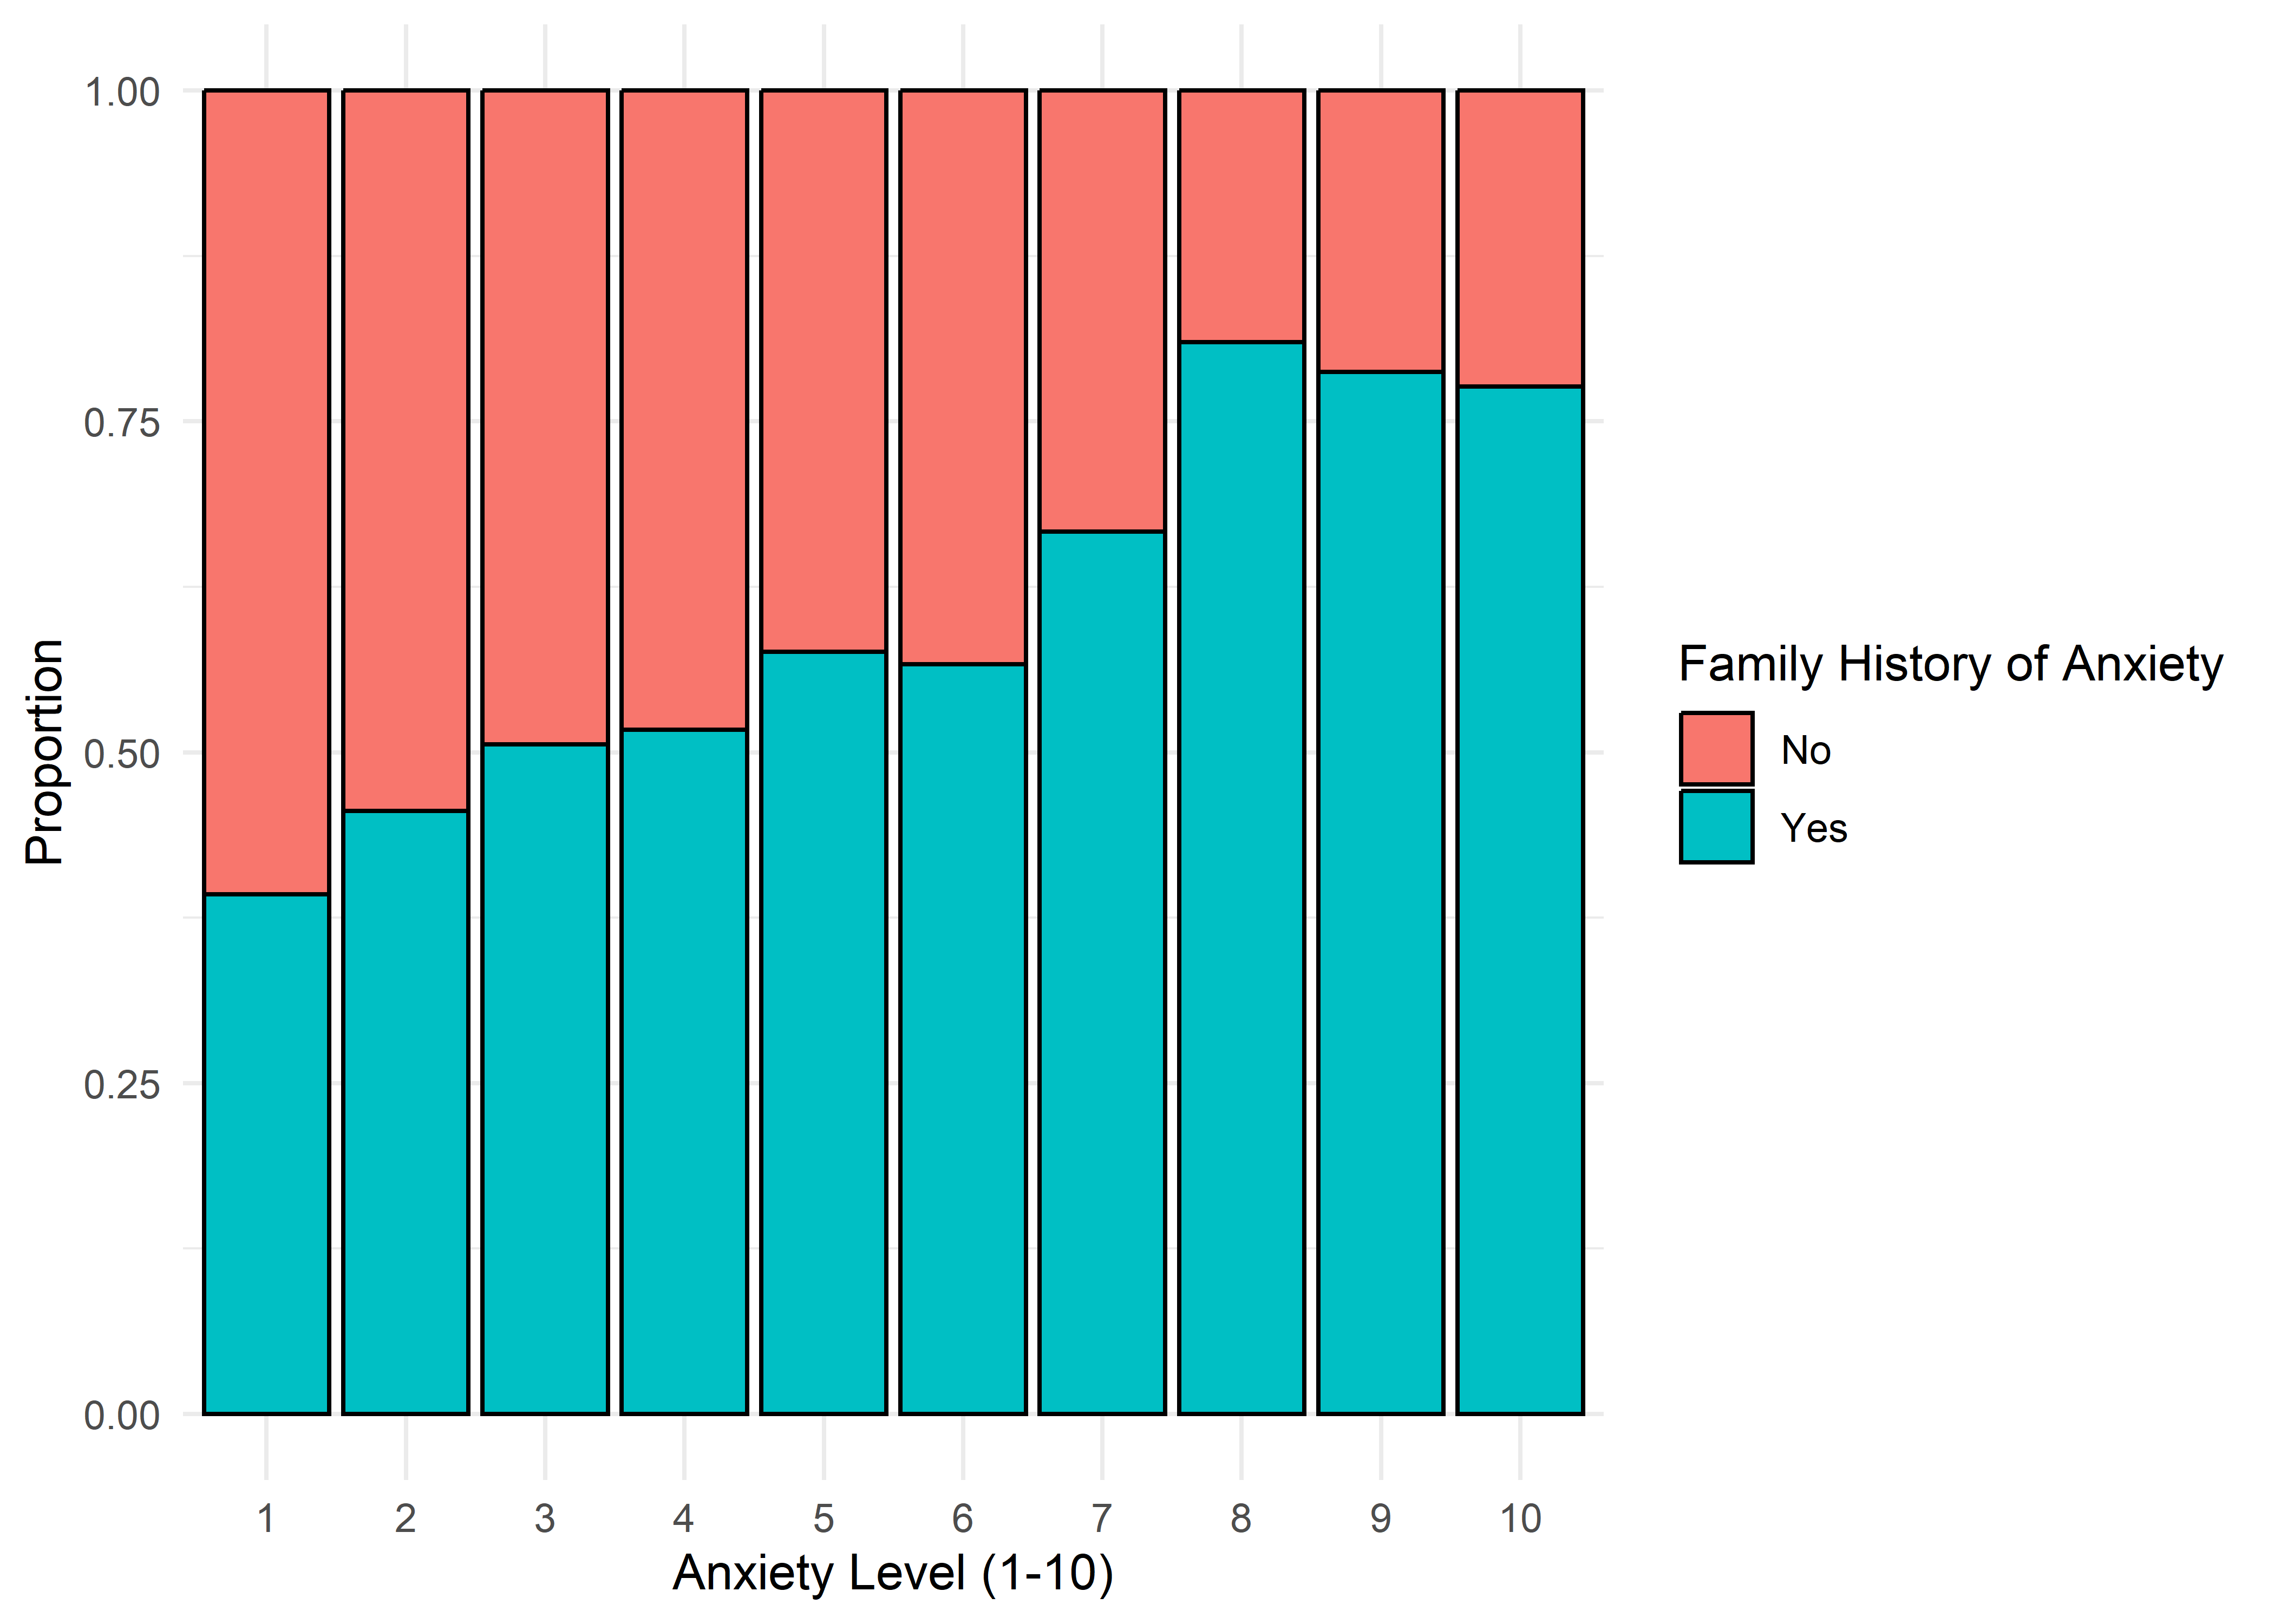
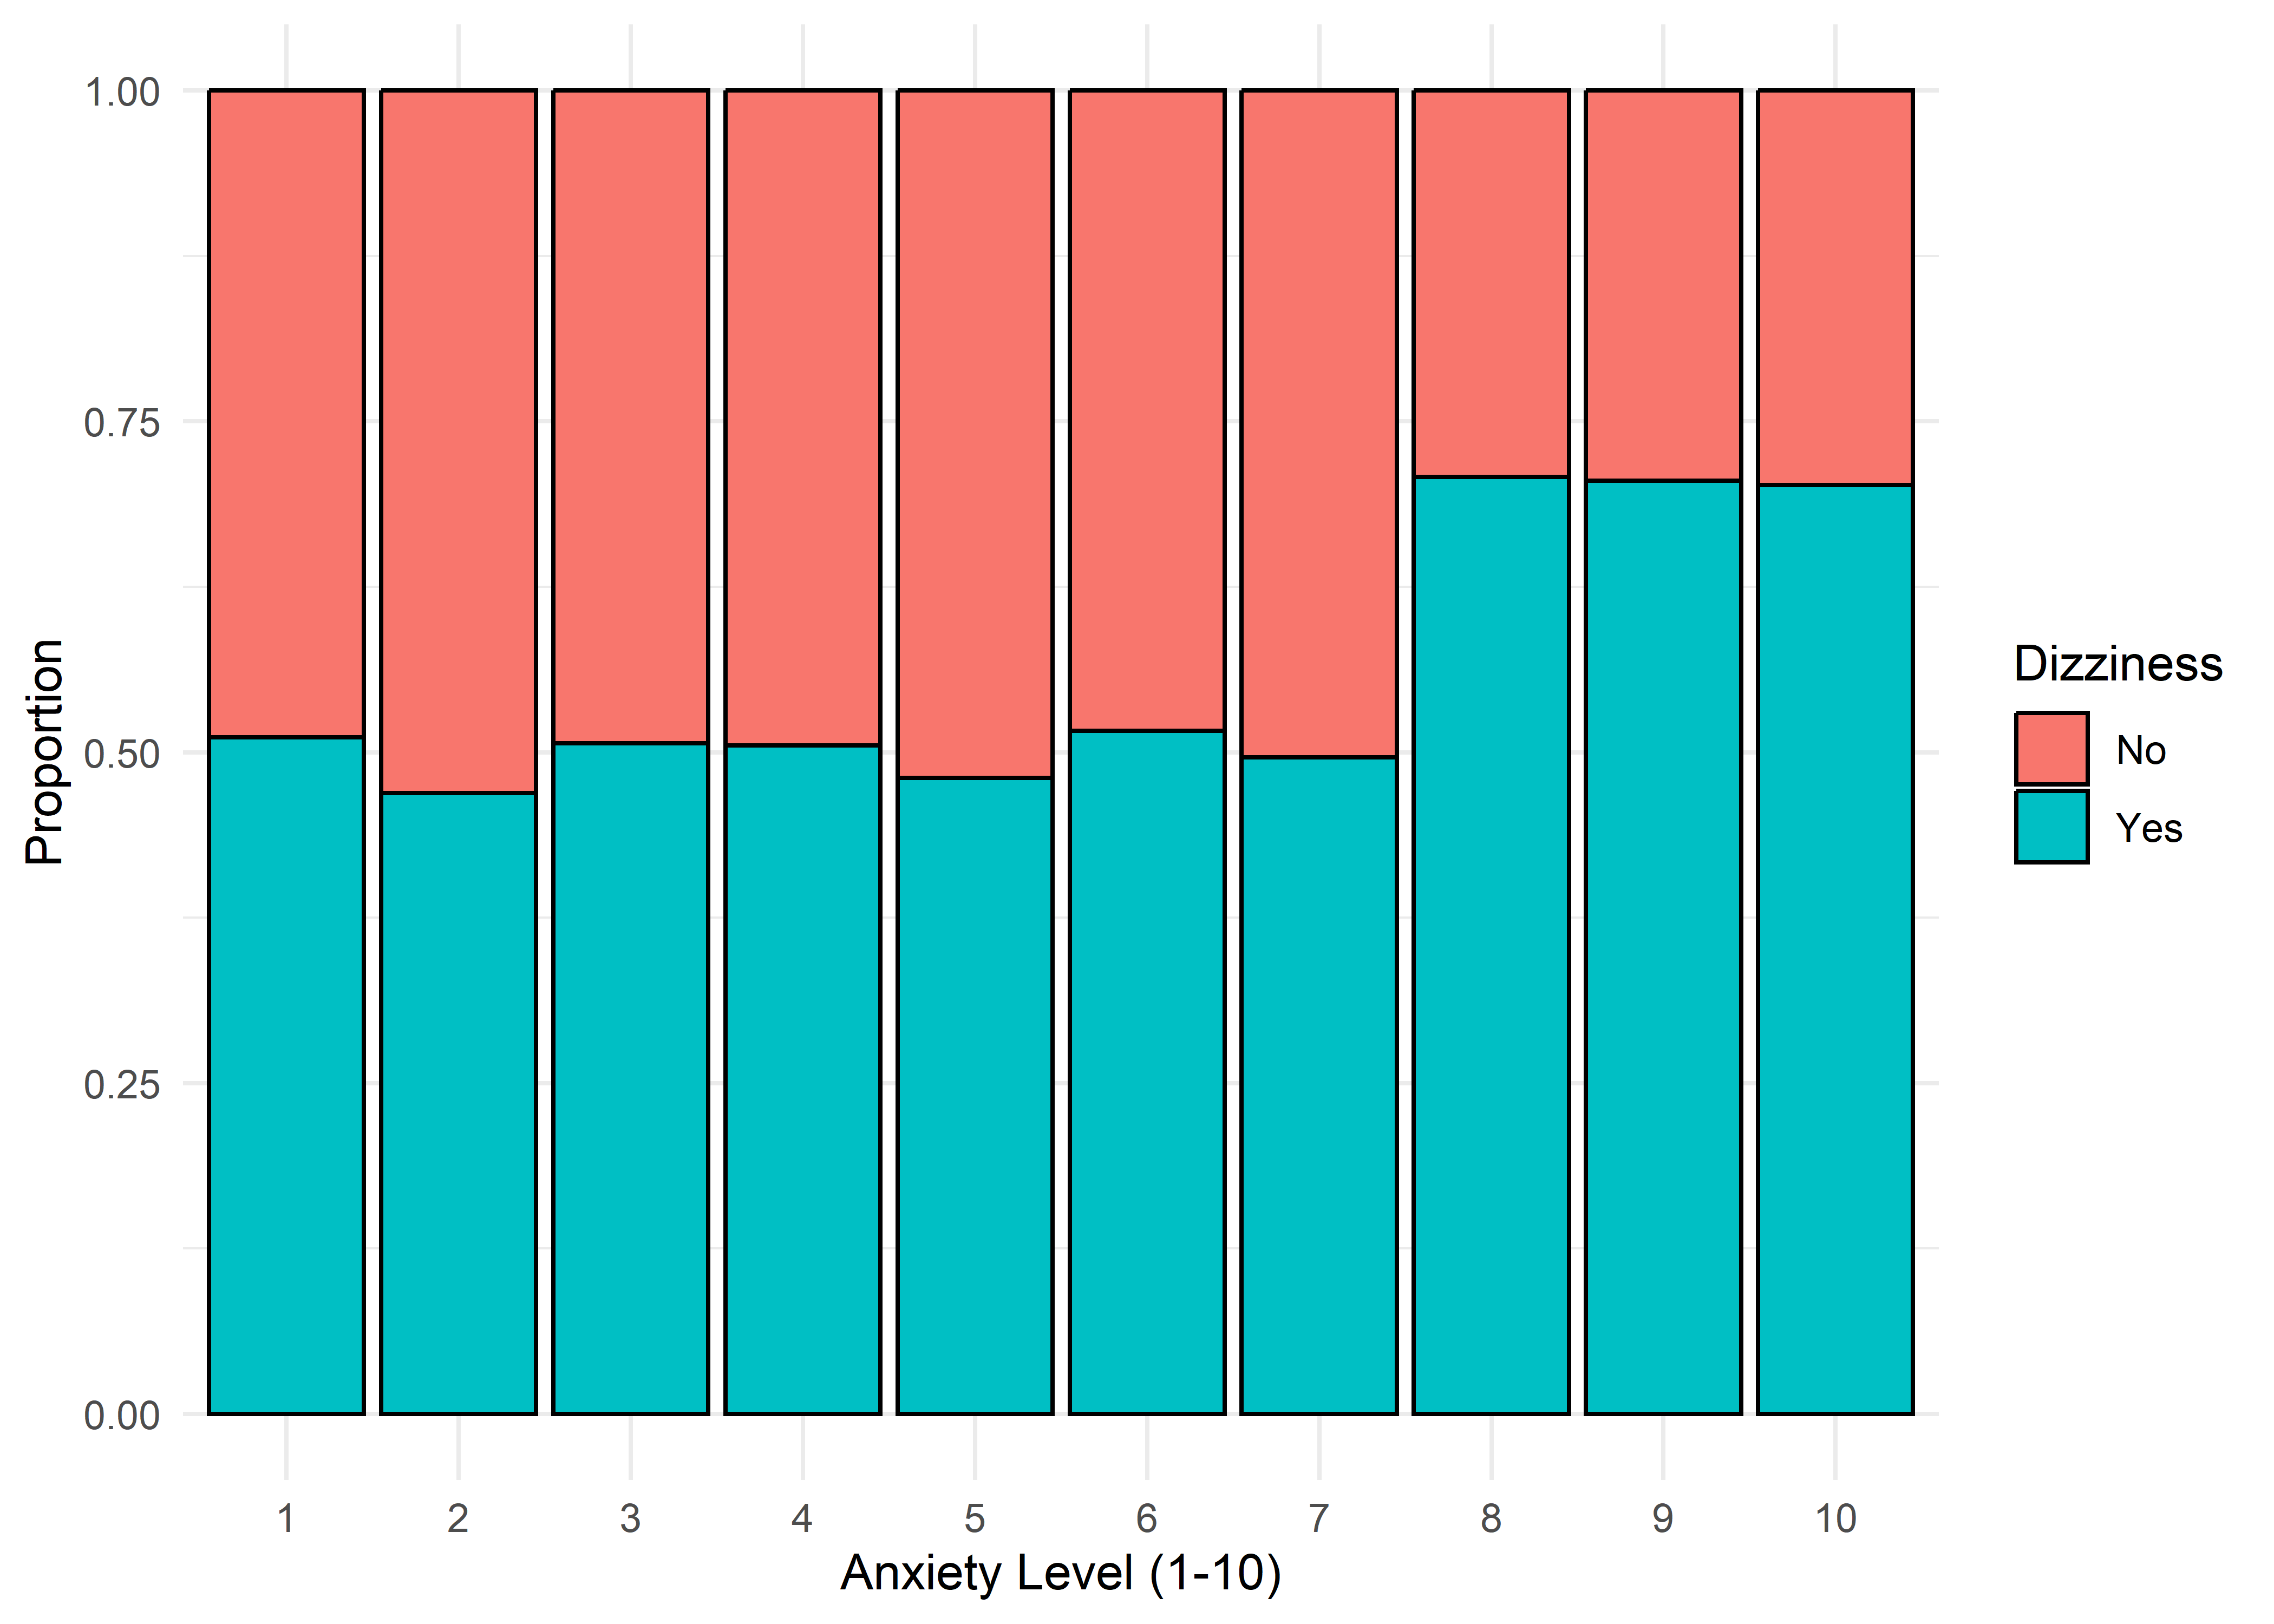
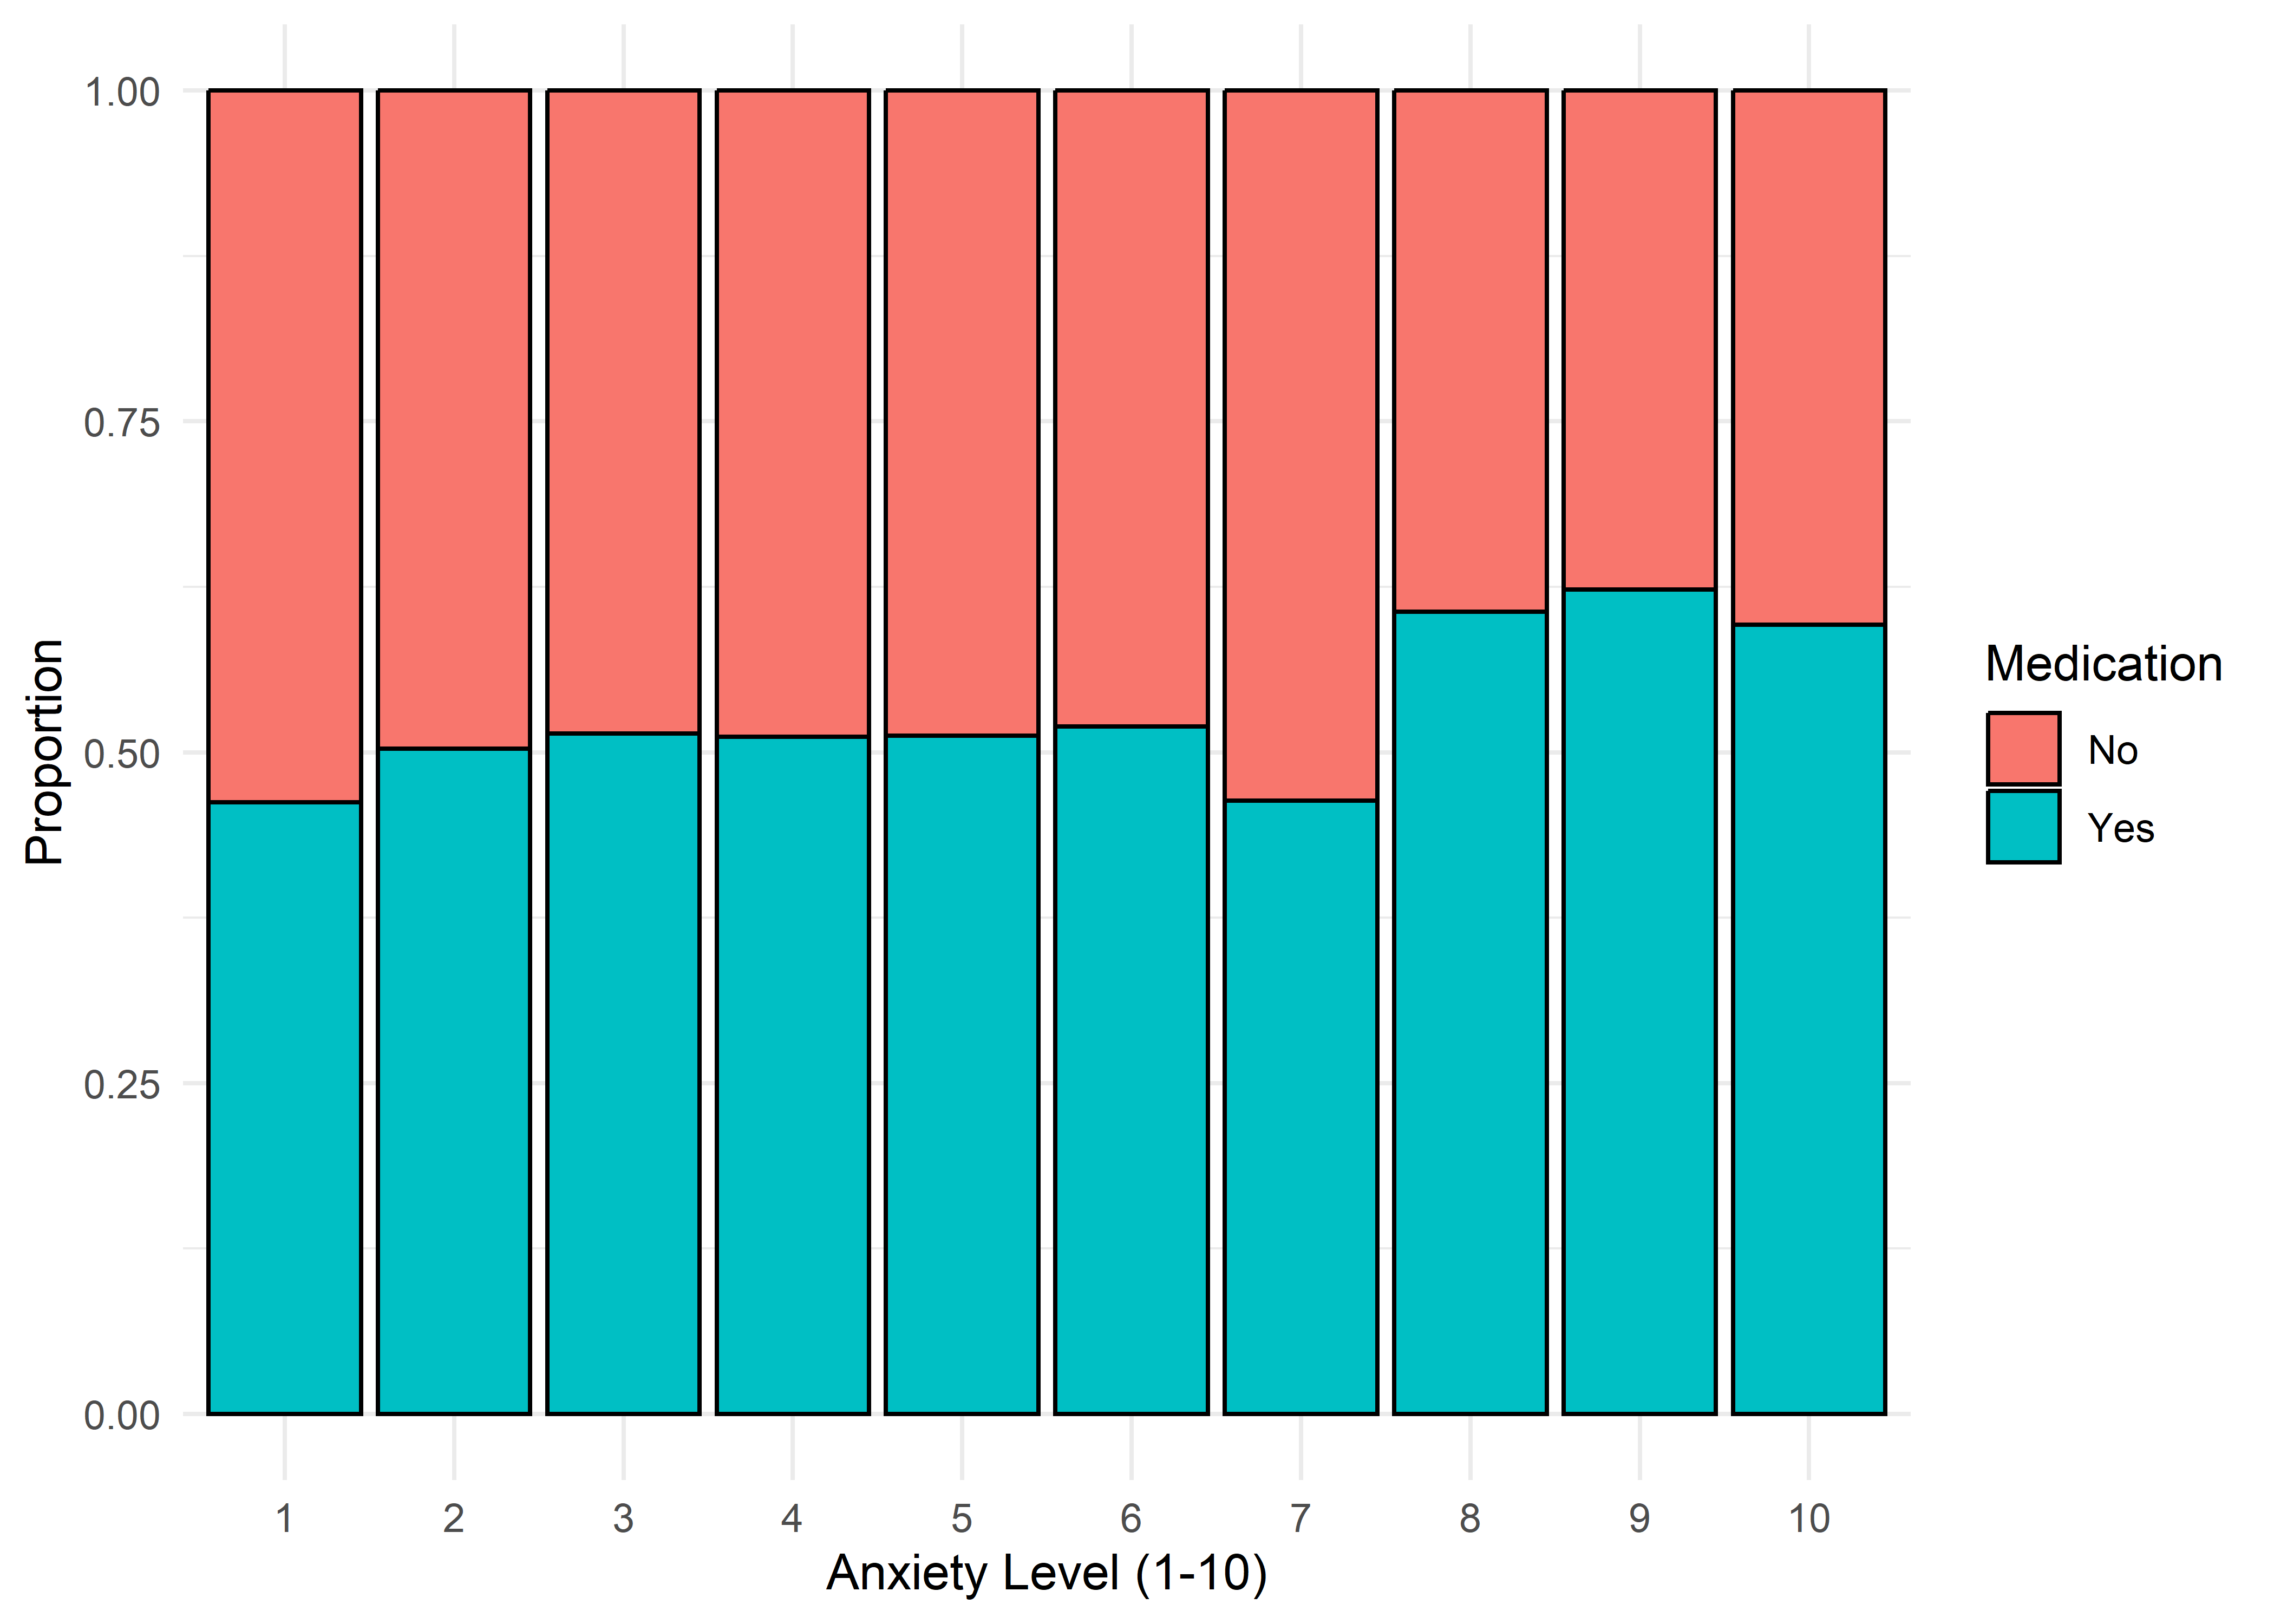
Gender,Smoking,Dizziness,Medication, andRecent Major Life Eventdisplay internally consistent distributions within levels 1–7 and within 8–10 — but the proportions differ markedly between these two ranges.Family History of Anxietyshows a clear increasing trend with Anxiety Level, which plateaus at higher levels.Occupationappears to have minimal association with anxiety — inter-group distributions are largely overlapping.
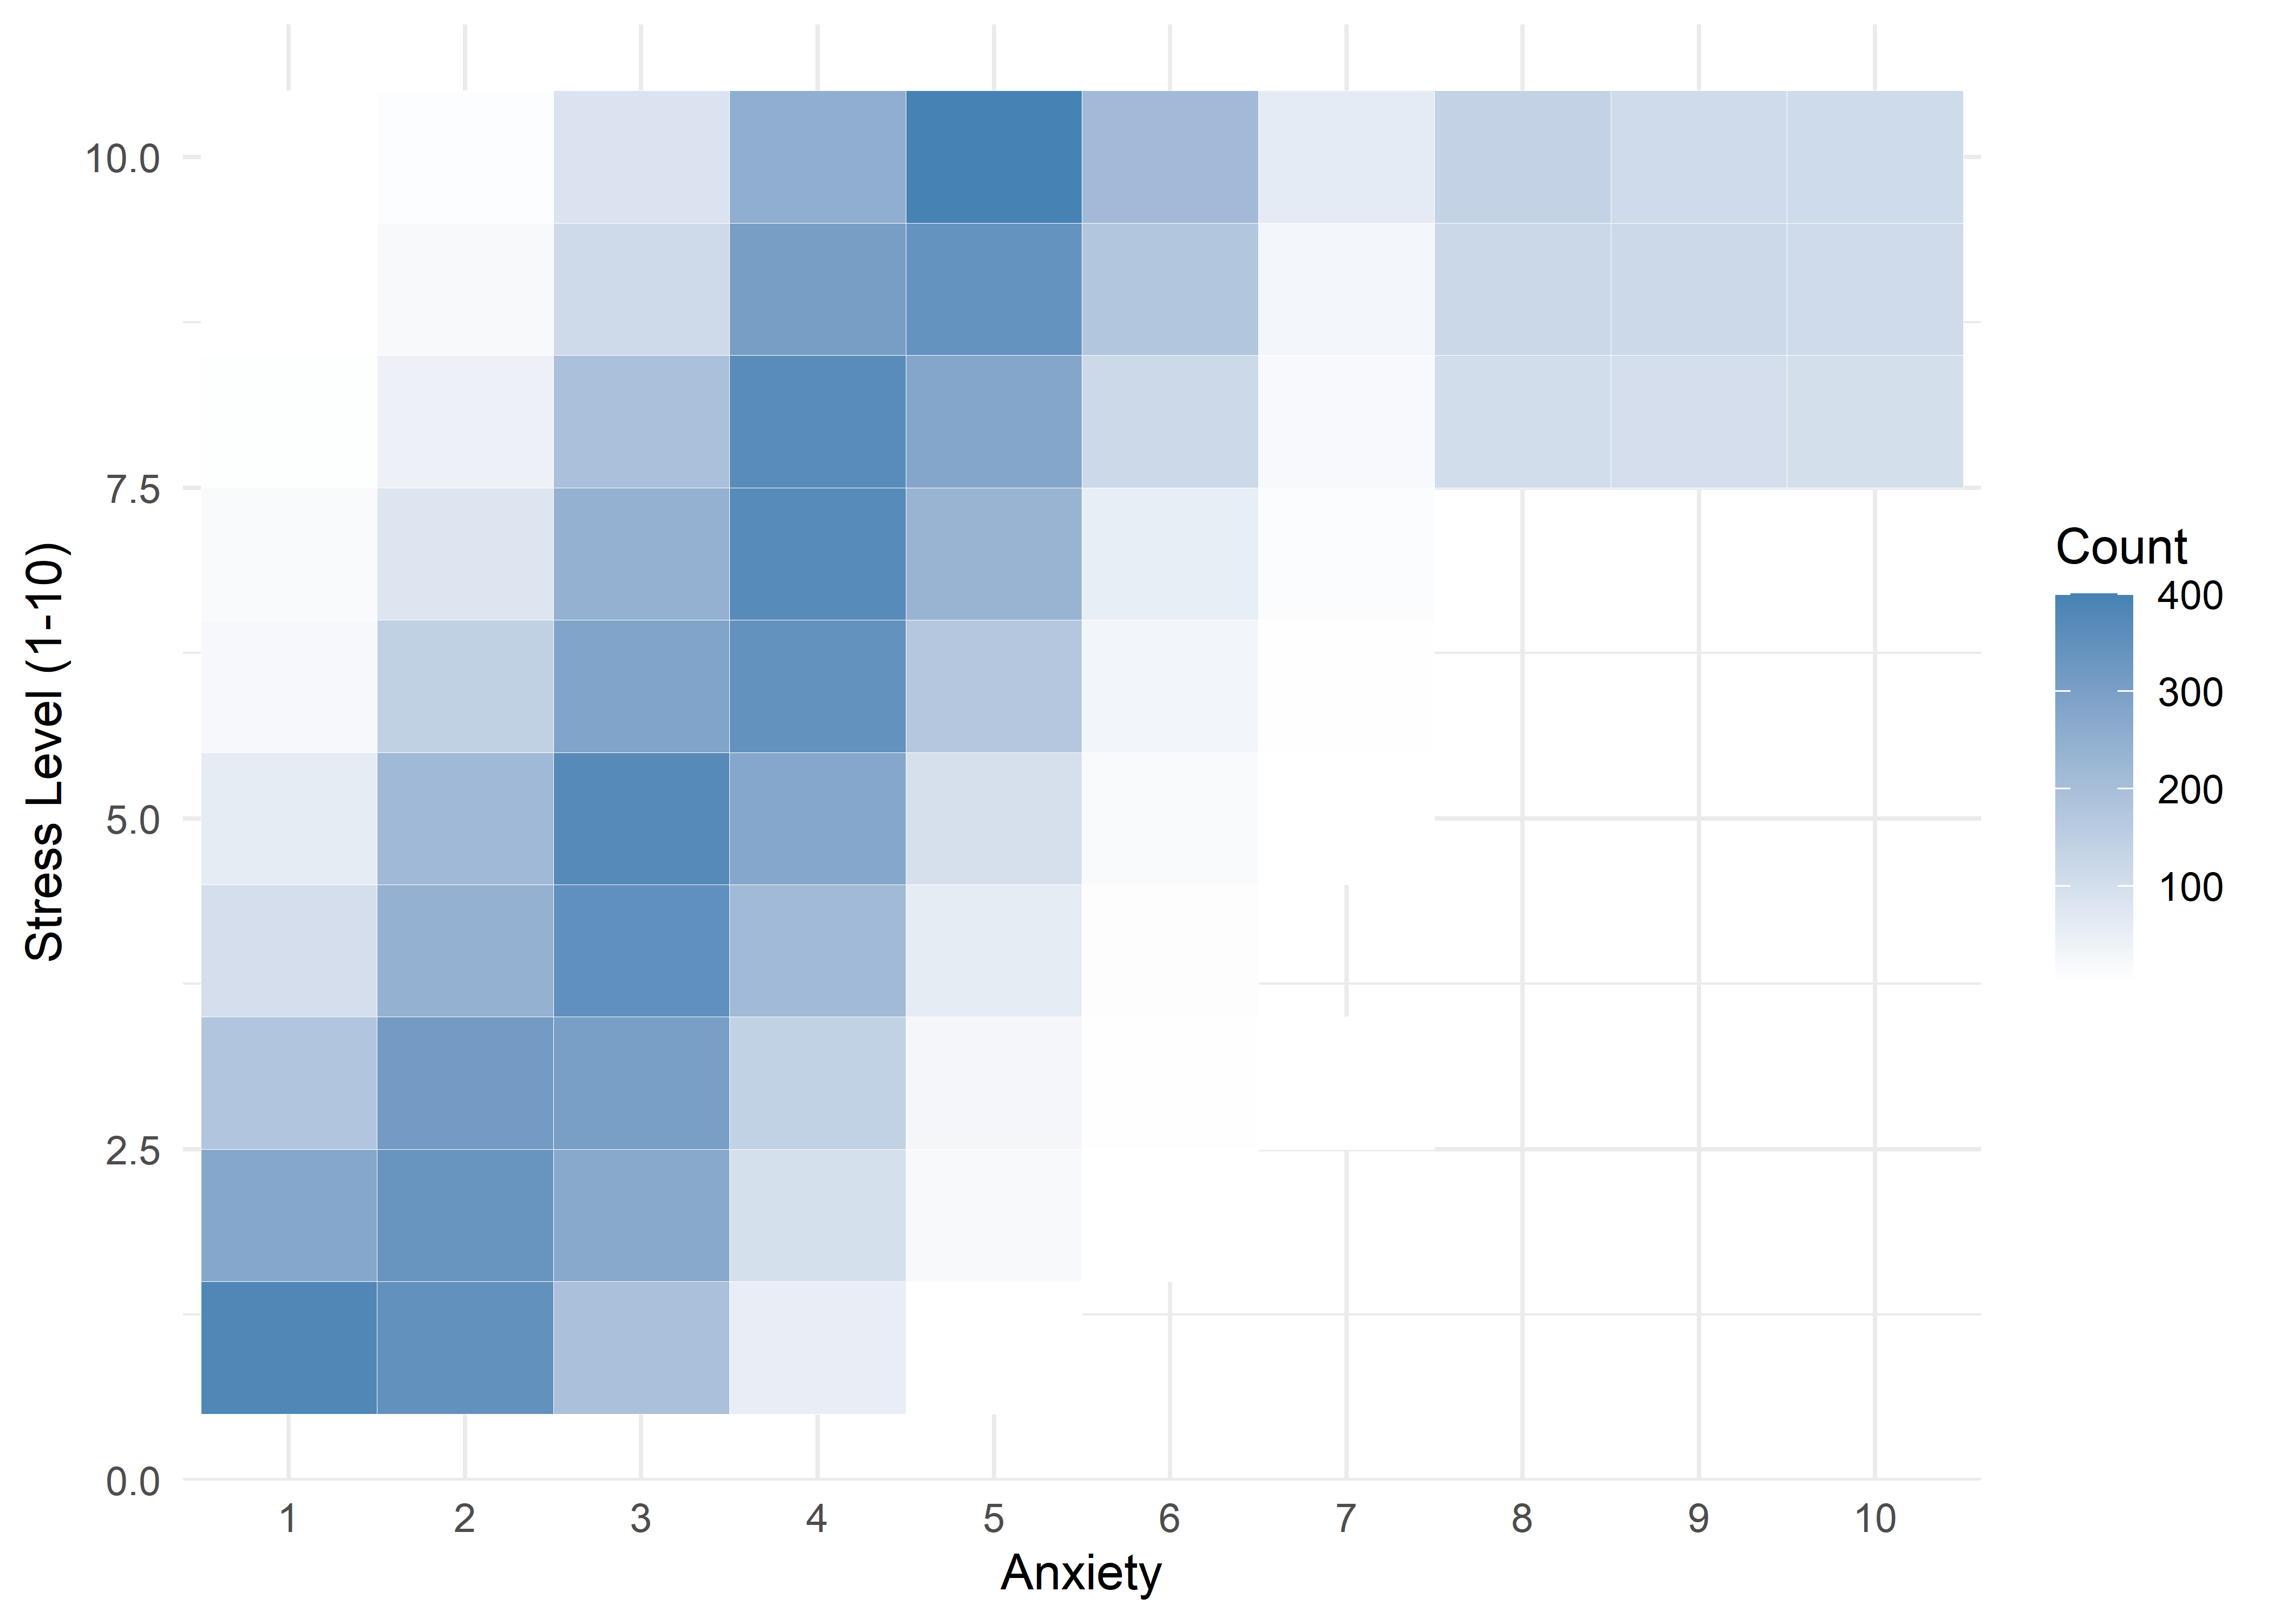
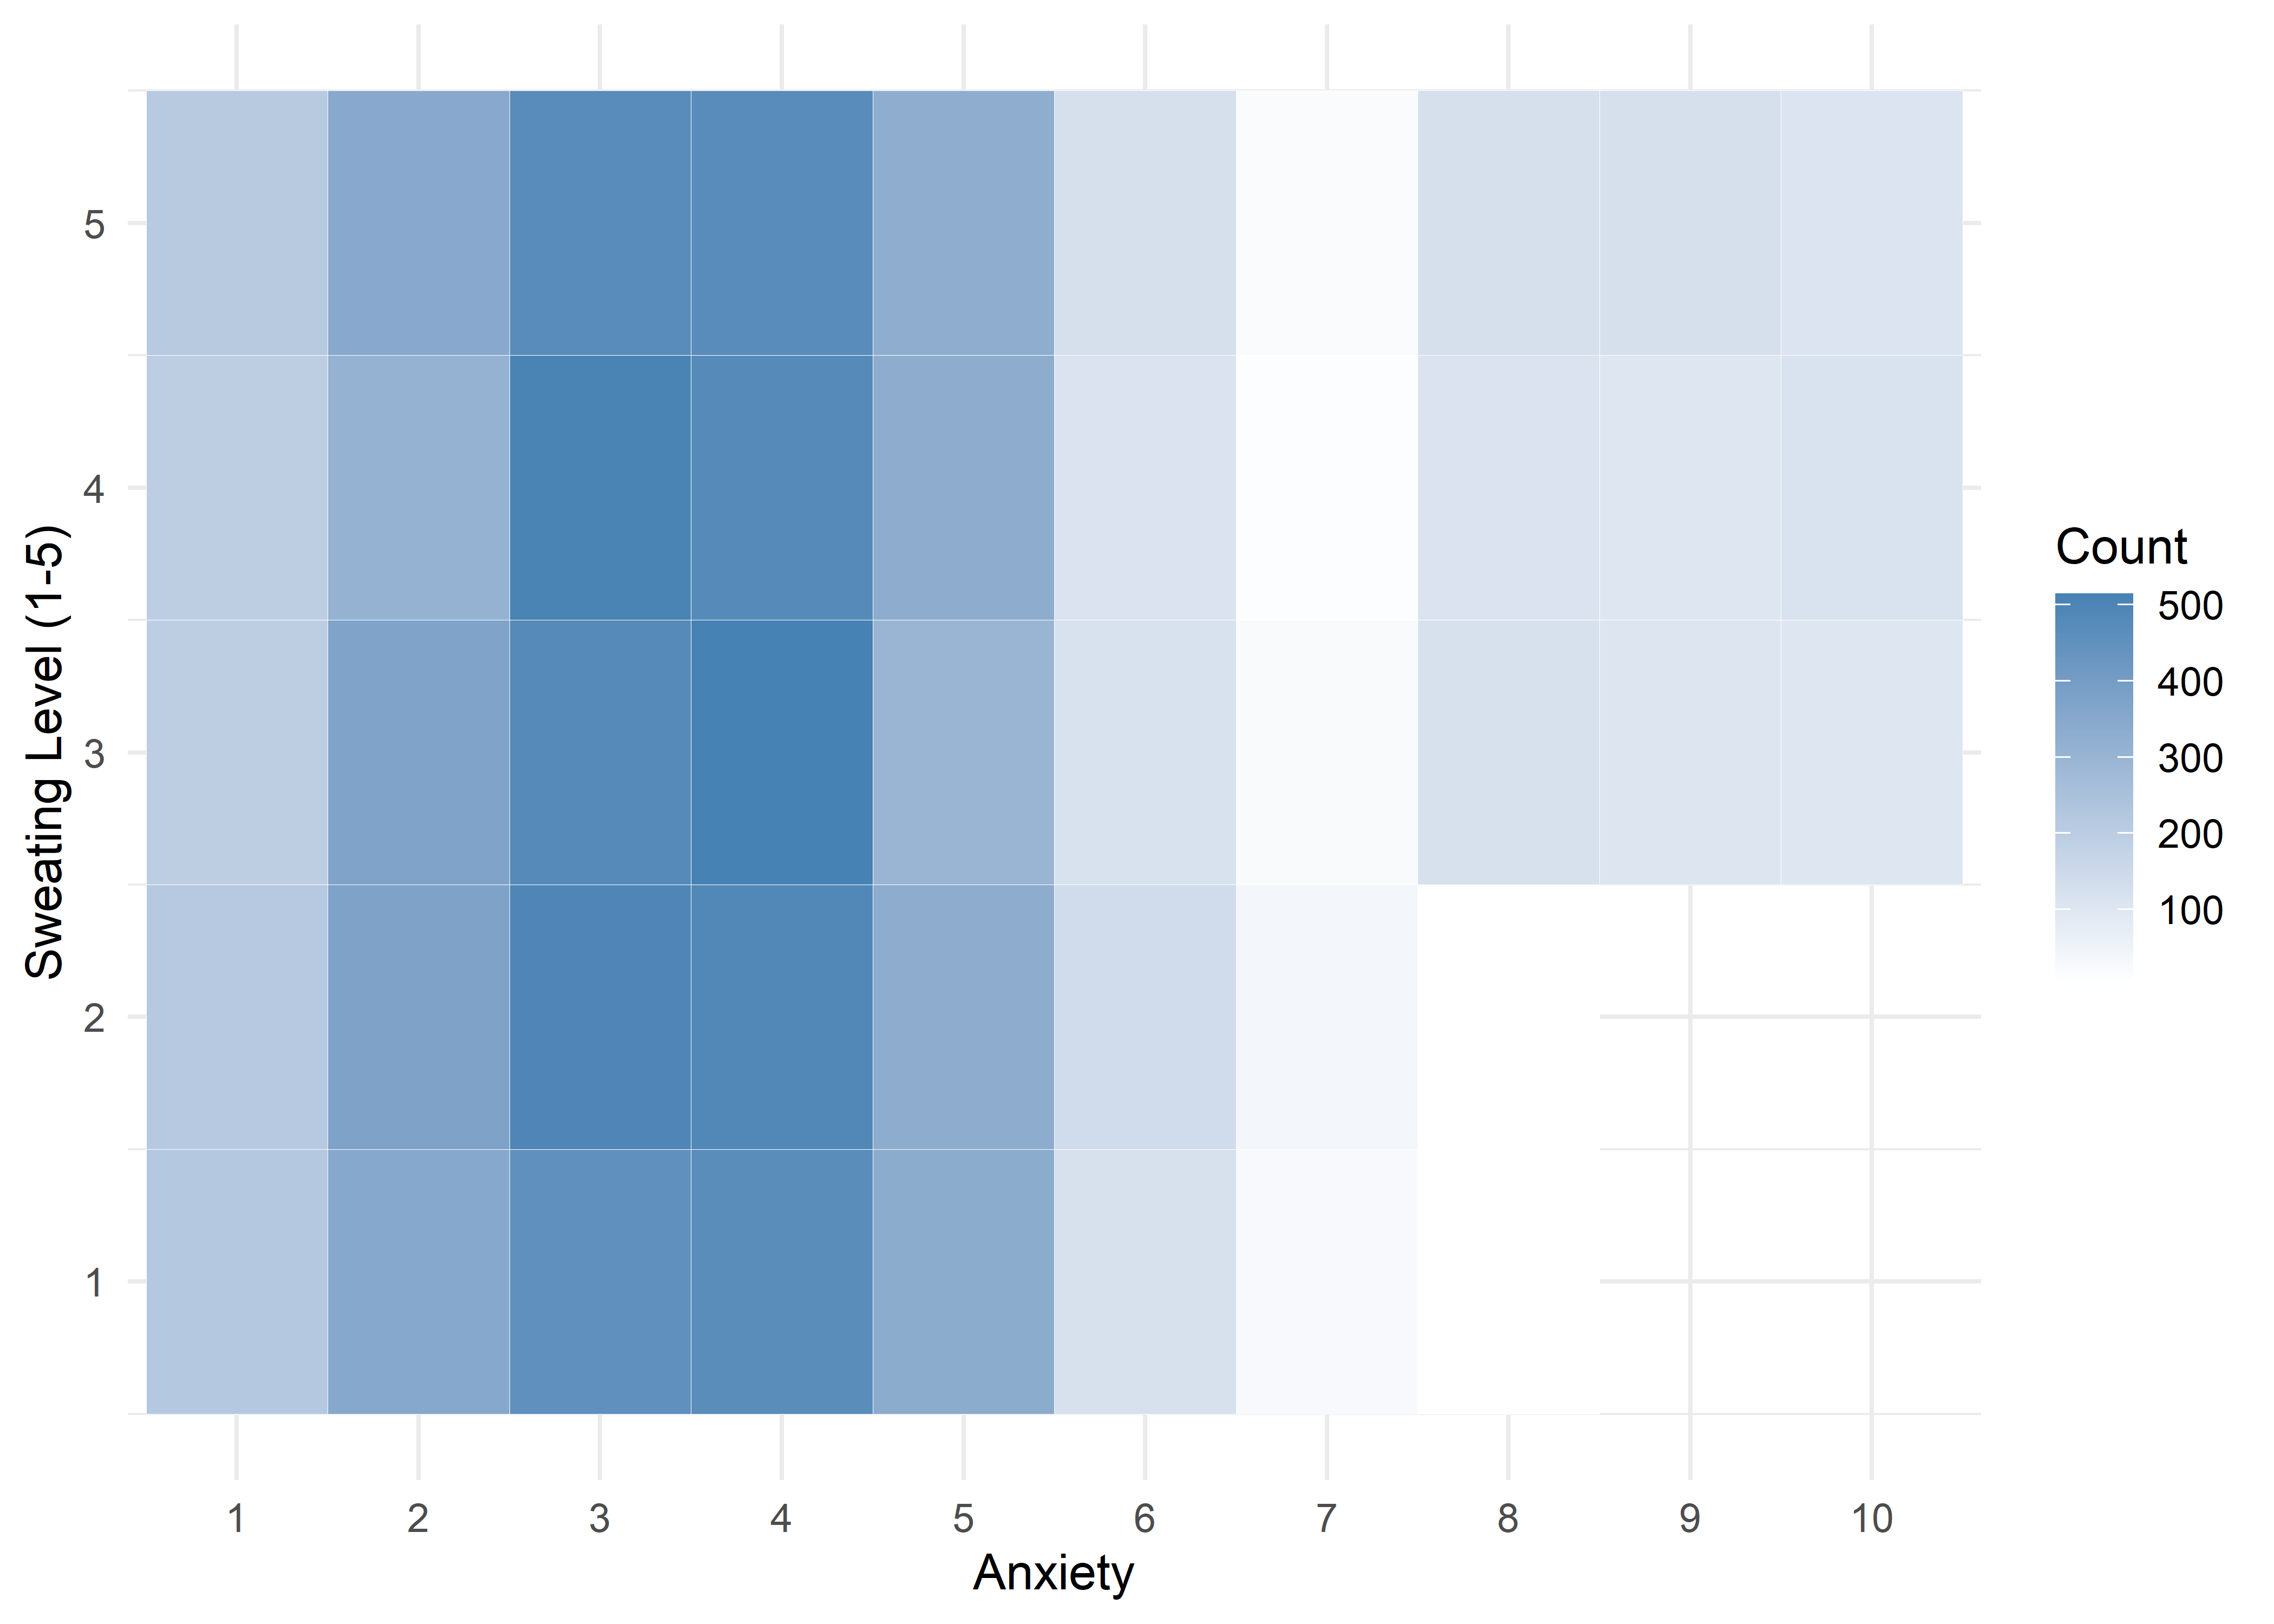
Numeric and Ordinal Variables
Age,Sleep Hours,Physical Activity, andHeart Rateshow relatively stable averages within levels 1–7, then shift to consistently different values for levels 8–10 — again supporting a two-regime structure.Caffeine Intakeincreases with anxiety level but levels off at the top three — similar to the Family History trend.Stress Levelincreases steadily with anxiety through level 6, has sparse data at level 7, and becomes uniformly high in the top three.Therapy Sessionsfollows a bimodal distribution with respect to anxiety. The lower anxiety group (1–7) is characterized by an approximately a concentrated cluster around low session counts (≈1/month), while levels 8–10 show a broader, less structured spread across session counts from 4 to 9. This separation suggests two distinct behavioral regimes — one centered and structured, the other elevated and diffuse.Alcohol Consumption,Breathing Rate,Sweating Level, andDiet Qualitydon’t show clear trends across the full scale but stand out for a different reason: none of the participants at levels 8–10 fall into the “healthy” range for these variables.
Modeling Implications
The analysis suggests a clear divide in how predictors relate to Anxiety Level: responses in the 8–10 range show different patterns than those in the 1–7 range across many variables. These differences are substantial enough to warrant treating the groups separately in modeling.
To address this, we adopt a stacked modeling strategy:
- A logistic model first distinguishes between Low / Moderate Anxiety (levels 1–7) and High Anxiety (levels 8–10).
- Then, two separate models are used:
- One to predict specific anxiety levels within the Low / Moderate group.
- Another trained only on the High Anxiety group.
This setup allows each model to focus on patterns that are internally consistent within its group, rather than forcing a single model to bridge competing dynamics. While this approach introduces additional complexity, it offers gains in both interpretability and performance. The specific challenges and decisions for each stage will be addressed in the modeling sections that follow.